Content
Content

Water and wastewater services
2.1. Institutional structure
Service delivery responsibilities
-
The water and wastewater sector includes drinking water, wastewater, and stormwater infrastructure and services.
-
Territorial local authorities currently provide most drinking water, wastewater and stormwater services, although there is some community self-supply and private sector provision.
-
The establishment of regional water service providers or council-controlled organisations for the water and wastewater sector will transition some of these services out of territorial authorities.
Governance and oversight
-
The Local Government (Water Services) Act 2025 requires local councils to deliver financially sustainable water services. The Commerce Commission must set information disclosure regulation for regulated water suppliers by February 2026, and price-quality regulation for Auckland’s Watercare Services Limited by mid-2028. The Commerce Commission can recommend increasing the level of economic regulation on water service suppliers via Orders in Council.
-
The Water Services Authority – Taumata Arowai regulates drinking water safety and monitors the environmental performance of drinking water services. It can also set National Engineering Design Standards for networks. The Water Services Act 2021 introduced stronger regulatory oversight, mandatory compliance, and higher accountability for suppliers following the public inquiry into the Havelock North drinking water contamination event in 2016.
-
Regional councils regulate freshwater and coastal water quality under the Resource Management Act 1991 and relevant national direction.
-
The Department of Internal Affairs provides policy stewardship for water and wastewater services. The Ministry for the Environment provides policy stewardship for freshwater, which water service providers interact with, and the Ministry of Health provide policy stewardship for the interface between water and public health. The Office of the Auditor-General provides independent financial oversight of the local government sector, including water services activities.
-
The industry body, Water New Zealand (WaterNZ), helps to set industry standards and produces guidelines for water entities on operations, procurement and regulatory compliance.
2.2. Paying for investment
-
Around 57% of users are charged through volumetric water charges. This number is skewed by volumetric charging in Auckland. For most New Zealand communities, water is still charged through rates on connected properties.158
-
Wastewater charges tend to be linked to volume metrics where present (as in Auckland) or set as a fixed charge as part of the rating process, with the method varying across local authorities.
-
Stormwater provision is typically provided through rates or targeted rates.
-
In recent years, some central government grants have supported water services, but this is not a persistent feature of the funding model.
2.3. Historical investment drivers
-
During the late 1800s and early 1900s, water networks were built in response to technological innovations (for example, indoor plumbing, flush toilets), public health drivers (reducing waterborne diseases in urban areas), and population growth.
-
Servicing growth and maintaining and renewing the existing network has been the focus of a significant amount of investment since the early 2000s.
-
Recent investment has been driven by a combination of tighter standards for water quality and growing networks to accommodate larger populations. Tighter standards include stricter environmental discharge limits and enhanced health protections in line with World Health Organization guidance.
-
Stormwater investment has lifted in recent years after the separation of wastewater and stormwater networks, and additional council focus on flood risk mitigation.
2.4. Community perceptions and expectations
This section summarises what we know about the New Zealand public’s perceptions and expectations of the water and wastewater sectors, at a national level.
-
Survey data suggests that having enough clean water, particularly safe drinking water, is an important priority for New Zealanders.159
-
Although New Zealanders rate the quality of our water and sewerage systems about the same as people in other countries, New Zealanders still perceive it as an investment priority.160
-
In a nationally representative survey undertaken by the Commission as part of consultation on the draft National Infrastructure Plan:
-
77% of New Zealanders reported that drinking water meets or exceeds their needs, while 23% reported it somewhat or consistently fails to meet their needs.
-
78% of New Zealanders reported that sewerage services meet or exceed their needs, while 22% reported it somewhat or consistently fails to meet their needs.
-
2.5. Current state of network
New Zealand’s difference from comparator country average

Comparator countries: Canada, Chile, Czechia, Greece, Finland, Iceland, Spain, and Sweden. Similarity based on income, population density, terrain ruggedness, urban populations, total population. Percentage differences from comparator country averages are based on a simple unweighted average of multiple measures for each outcome. Further information on these comparisons is available in a supporting technical report.161 This data is for wastewater, stormwater (investment only), and drinking water services, but excludes irrigation and flood protection infrastructure that is unrelated to drainage.
-
After being one of the lowest spending countries from 1980–1995, New Zealand’s investment in water is now among the highest in the OECD, and much higher than most of our comparator countries.
-
Relative to comparator countries, New Zealand’s water network is similarly sized in terms of length but has fewer connections. Despite relatively low connection numbers, according to the OECD New Zealand uses 253 cubic metres of drinking water per capita annually, considerably higher than all comparator countries. This is equivalent to 690 litres per person per day, similar to the 550 to 650 litres per connection per day reported by the Water Services Authority – Taumata Arowai.162
-
While parts of our water network have high leakage rates, average national leakage rates are similar to the comparator country average.
-
The Commission also publishes performance dashboards that can be used to understand changes in the performance of New Zealand’s water sector over time.163
2.6. Forward Guidance for capital investment demand
Forecast investment levels for water and waste

Our Forward Guidance is based upon categories of investment and capital stock data from Stats NZ, where waste and water services are combined. We estimate that waste is a very small percentage of this category, so our Forward Guidance for the sector can be interpreted as mostly water. This table provides further detail on our Forward Guidance, which is summarised in Chapter 3. Further information on this analysis and the underlying modelling assumptions is provided in a supporting technical report.164 This data is for wastewater, stormwater, and drinking water services, but excludes irrigation and flood protection infrastructure that is unrelated to drainage.
- Investment in water and waste infrastructure in New Zealand has been elevated (nearly the highest in the OECD) as a share of GDP for the last 20 years, following a period of underinvestment from 1975 to 2000.
- Investment levels between 2010 and 2022 were partly driven by a backlog of renewals, but this alone does not explain the scale of spending. Other factors, including stricter regulatory compliance for drinking water and wastewater, higher environmental performance expectations, and growth in networks to service population growth, have played a significant role.
- Going forward, renewal and replacement of existing infrastructure is expected to be the largest driver of investment. At a national level, slowing population and income growth is expected to reduce demand for network expansions and improvement, although localised population growth will continue to drive high demand in some areas.
- Adapting to natural hazard risk is a growing investment driver for water networks. According to research completed by the Commission and Earth Sciences New Zealand, water networks are especially exposed to coastal and riverine flooding, both of which are expected to worsen with climate change.
2.7. Current investment intentions
- Water investment has risen in recent years. Forward investment intentions significantly exceed our Forward Guidance. This divergence appears to be driven by the sector’s intentions to address higher quality standards.
- Councils have now confirmed their individual water service delivery plans (WSDPs). While the Commission did not analyse these plans to inform the National Infrastructure Plan, we note that public information on the WSDPs suggests future investment will be approximately $10 billion higher than forecasts contained in councils’ long-term plans. This is due to more up-to-date figures, and some councils getting extensions for their long-term plans.
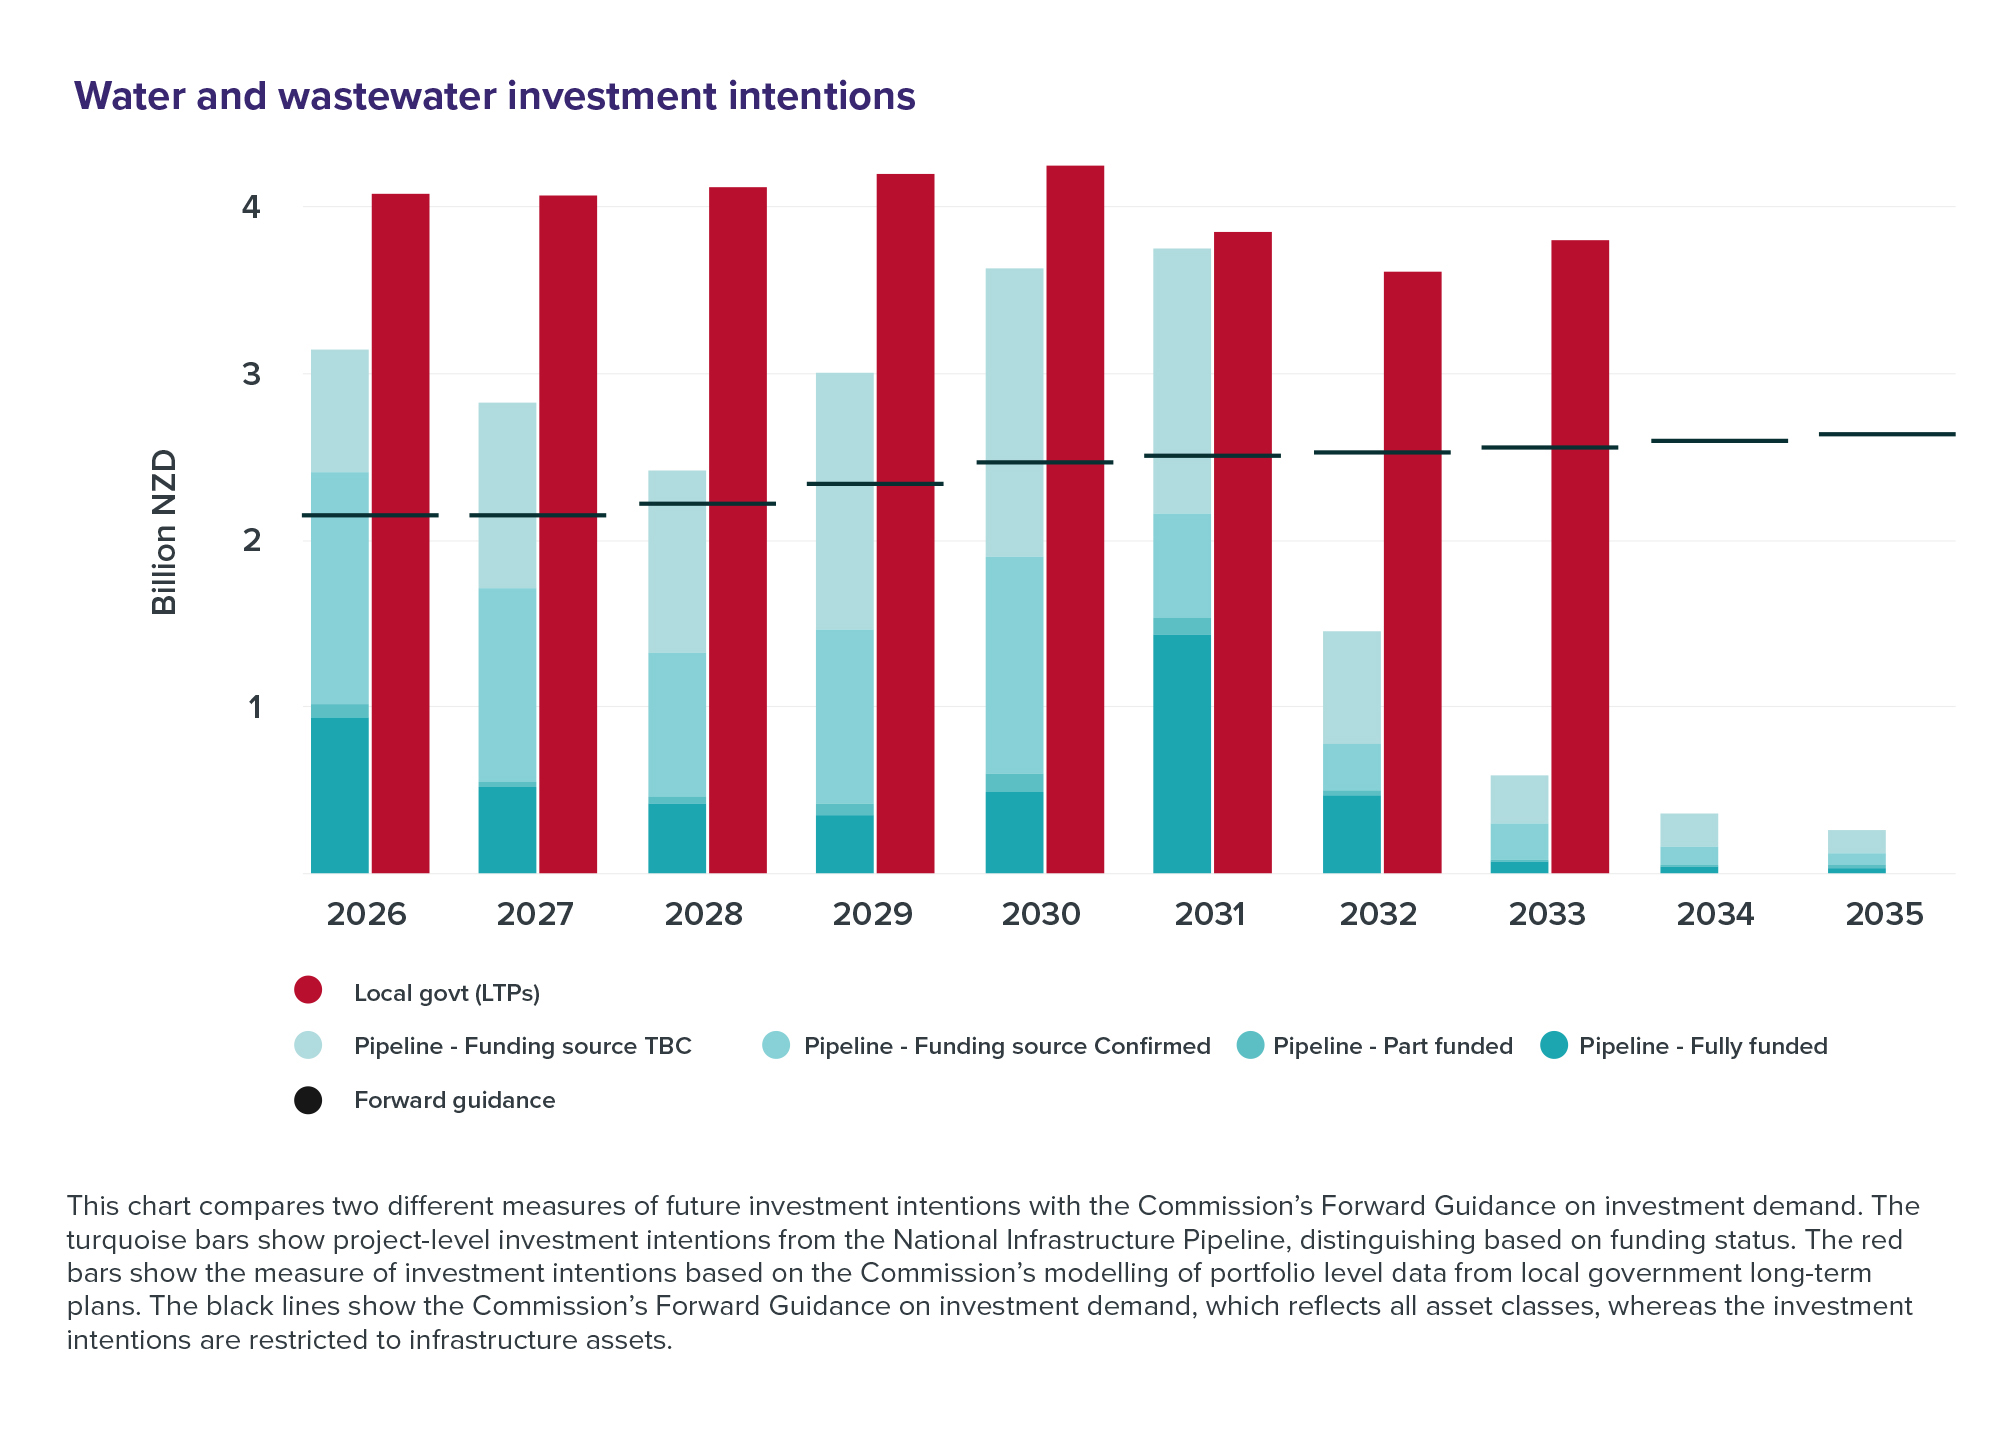
- The following chart depicts projected spending to deliver initiatives in planning and delivery in the Pipeline (turquoise bars), and programme-level intentions in local government long-term plans (red bars). These investment intentions are significantly higher than the Commission’s investment demand outlook (black lines) over the 2026–2035 period.
Figure 47: Water and wastewater investment intentions

This chart compares two different measures of future investment intentions with the Commission’s Forward Guidance on investment demand. The turquoise bars show project-level investment intentions from the National Infrastructure Pipeline, distinguishing based on funding status. The red bars show a measure of investment intentions based on the Commission’s modelling of portfolio-level data from councils’ long-term plans. The black lines show the Commission’s Forward Guidance on investment demand. This reflects all asset classes, whereas the investment intentions are restricted to infrastructure assets.
2.8. Key issues and opportunities
- User affordability: Over the next decade, councils are planning to spend close to $50 billion on their water networks. While access to clean, safe drinking water is critical, it is likely this level of investment will face affordability concerns from residents and businesses and could crowd out other local infrastructure priorities. Significant efforts are needed to improve the affordability of water infrastructure, including water metering and volumetric charging to manage demand, and pursuing lower-cost and non-built solutions on the supply side.
- Governance and oversight: Economic regulation of drinking and wastewater services is an opportunity for the sector to ensure full cost recovery, efficient investment programmes, and good asset management. It is also an opportunity to increase transparency on asset conditions and delivery performance.
- Coordination: There are several opportunities to achieve better scale and industry responsiveness through coordination activities:
- The establishment of regional water services providers or council-controlled organisations for water, along with effective economic regulation, could enable a more effective response to investment needs.
- Better coordination between spatial planning, consenting, and strategic water infrastructure planning could help to deliver the right-sized projects at the right times.
- Water planning boundaries are often defined by watersheds which may in some cases constrain water infrastructure planning or delivery. Cross-boundary infrastructure planning and development could help leverage water asset capacity in neighbouring areas, leading to more efficient procurement processes and improved maintenance of critical assets.
- Ongoing efforts to develop national standards for water and wastewater infrastructure could reduce costs and streamline consenting processes.
- Regulatory and policy certainty: Water reforms proposed by successive Governments have increased uncertainty for councils, making it more difficult to plan water investments. Providing consistent policy and regulatory certainty and utilising spatial planning will be key to enabling the transition to more efficient investment and delivery of water services. In addition, consenting for dams, water extraction and discharges can add to the challenges and costs of developing water and wastewater assets.
- Population and demographics: Slow population growth or declining populations in smaller towns and rural areas, combined with an ageing population profile, will create issues around funding the maintenance and continuity of water and wastewater services. Conversely, faster growing cities like Auckland, Tauranga, Hamilton, and Christchurch will need to accommodate growth by building out networks to new areas and increasing the capacity of existing facilities.