Content
Content

Electricity
3.1. Institutional structure
Service delivery responsibilities
- New Zealand’s predominant forms of energy used by households and businesses, other than transport, are electricity and gas. The electricity sector value chain consists of electricity generation, transmission, distribution, and retail. Transmission and distribution services are natural monopolies and remain largely separated from competitive generation and retail segments following pro-competition reforms in the 1990s. Four large generator-retailers (‘gentailers’) are vertically integrated across generation and retail and compete with independent generators and retailers in the retail and wholesale markets.
- Transpower occupies two distinct but critical roles in the electricity system. First, as grid owner it provides the transmission infrastructure to move electricity from where it is generated to where demand is located across New Zealand. Second, it is the appointed system operator responsible for operating the wholesale electricity market, ensuring the real-time coordination of the electricity system and reporting on security of supply.165
- There are 29 electricity distribution businesses that own and operate the poles and wires that deliver electricity from the national grid to end consumers. Each business covers its own geographic area, and they vary significantly in size and ownership structure.
- Electricity infrastructure and services are provided by commercial entities, some of which are fully or partly owned by central or local government. Central government is the majority shareholder of three gentailers (Genesis, Meridian, and Mercury) and the transmission owner (Transpower). Electricity distribution businesses are owned by a mix of private investors, councils and consumer trusts.
Governance and oversight
- The sector is regulated under the Electricity Act 1992 (reform foundations and safety), and the Electricity Industry Act 2010 (established the Electricity Authority). The Commerce Act 1986 empowers the Commerce Commission to regulate 'markets where there is little or no competition', which covers Transpower and electricity distribution businesses.
- The Electricity Authority oversees and regulates the electricity sector, administering the Electricity Industry Participation Code, contracting for market operation services, monitoring and enforcing compliance, facilitating markets, and monitoring and reporting on the industry and markets. The Electricity Authority also regulates the structure of transmission and distribution pricing. The Commerce Commission regulates electricity distribution and transmission networks, with price paths limiting allowable revenues for Transpower and 16 of the 29 electricity distribution businesses.
- Transpower, as the grid owner, prepares a range of technical standards and operating codes that the Electricity Industry Participation Code requires participants in the electricity sector to comply with.
- As system operator, Transpower operates the system to ensure that frequency and grid stability are maintained, and generation is dispatched on a least-cost basis through a wholesale spot market.166 The New Zealand Stock Exchange (NZX) holds service provider contracts with the Electricity Authority to support the spot market with information, reconciliation, and clearance services.167
- A financial futures market operated on the Australian Stock Exchange (ASX) supports exchange traded forward contacts or hedges to manage financial exposure to wholesale prices.
- The Ministry of Business, Innovation and Employment (MBIE) undertakes monitoring, reporting and policy functions across the energy sector, including publishing the Electricity Demand and Generation Scenarios. The Treasury monitors state-owned enterprises and mixed-ownership model companies from a commercial ownership perspective.
3.2. Paying for investment
- Electricity services are funded by electricity users. All costs of generating, transmitting, distributing, retailing, and operating the electricity system (along with the cost of purchasing carbon emissions units through the Emissions Trading Scheme) are passed through to customers.
- Electricity generators sell into a competitive wholesale market that is cleared as a central pool. Locational marginal pricing in the wholesale market helps signal opportunities for investment in additional capacity. Households tend to experience average or smoothed electricity prices, rather than being exposed to the spot market directly, with some industrial customers supplied through long-term power purchase agreements.
- Charges from regulated transmission and distribution businesses are increasing. The annual increase in 2025 was about $10 per month for the average household. The annual increase for 2026 to 2030 is estimated to be around $5 per month for the average household. These increases are driven by an increase in expenditure for reliability, demand growth and resilience needs (45% of the increase), rising input costs (25% of the increase), and a substantive rise in the cost of capital since 2020 (30% of the increase).168
- Direct central government financial support for electricity and gas infrastructure is rare, although central government does provide financial support to some households with the Winter Energy Payment, which is provided to all beneficiaries regardless of energy use.
3.3. Historical investment drivers
- Investment in electricity networks peaked from the 1950s through to the 1980s, as New Zealand added significant capacity to the network. Investment responded to technological innovation requiring more electricity usage, industrialisation, and population growth. In recent decades, growth in demand for electricity investment has been relatively subdued.
- Investment to serve demand growth for electricity is driven by factors like population growth, shifting technologies around energy usage (such as electric vehicles) and commercial/industrial usage.
- In electricity, investment in networks and generation capacity occurs to supply peak demand or provide resilience against outages. Investment in a variety of competing generation technologies has occurred over time to provide adequate supply of energy, including during sustained dry periods, and the lowest competitive prices. Investment in distributed generation is increasing as costs of new technology fall.
- New Zealand’s legislated net zero carbon emission goals and broader energy market policy settings impact both gas and electricity investment.
3.4. Community perceptions and expectations
This section summarises what we know about the New Zealand public’s perceptions and expectations of the electricity sector, at a national level.
- In general, New Zealanders’ expectations for the reliability of electricity seem to be well met.169
- However, there is a general perception that electricity prices are higher than the costs to supply.170
- New Zealanders are increasingly concerned about the electricity sector’s ability to ensure electricity supply will be sufficient in the future.171
- Most New Zealanders support electricity charges that are based on usage.172
- In a nationally representative survey undertaken by the Commission as part of consultation on the draft National Infrastructure Plan, 71% of New Zealanders reported that electricity services meet or exceed their needs, while 29% reported it somewhat or consistently fails to meet their needs.
3.5. Current state of network
New Zealand’s difference from benchmark country average

Comparator countries: Canada, Chile, Columbia, Costa Rica, Finland, Iceland, Norway, and Sweden. Similarity based on income, population density, terrain ruggedness, urban populations, energy exports, heavy industry share of GDP. Percentage differences from comparator country averages are based on a simple unweighted average of multiple measures for each outcome. Further information on these comparisons is available in a supporting technical report.173
- Our electricity networks are somewhat unique relative to other countries. We have a comparatively large transmission network, reflecting long distances between our generation plant and where we consume electricity, with no grid interconnections with other countries.
- Investment levels are about average compared to our peers.
- Outages in New Zealand appear to be more frequent in number and duration than peer countries and are among the highest in the OECD. However, electricity generation in New Zealand produces very low emissions relative to the OECD average and comparator countries.
- The Commission also publishes performance dashboards that can be used to understand changes in the performance of New Zealand’s energy sector over time.174
3.6. Forward Guidance for capital investment demand
Forecast investment levels for electricity (generation, transmission, and distribution)
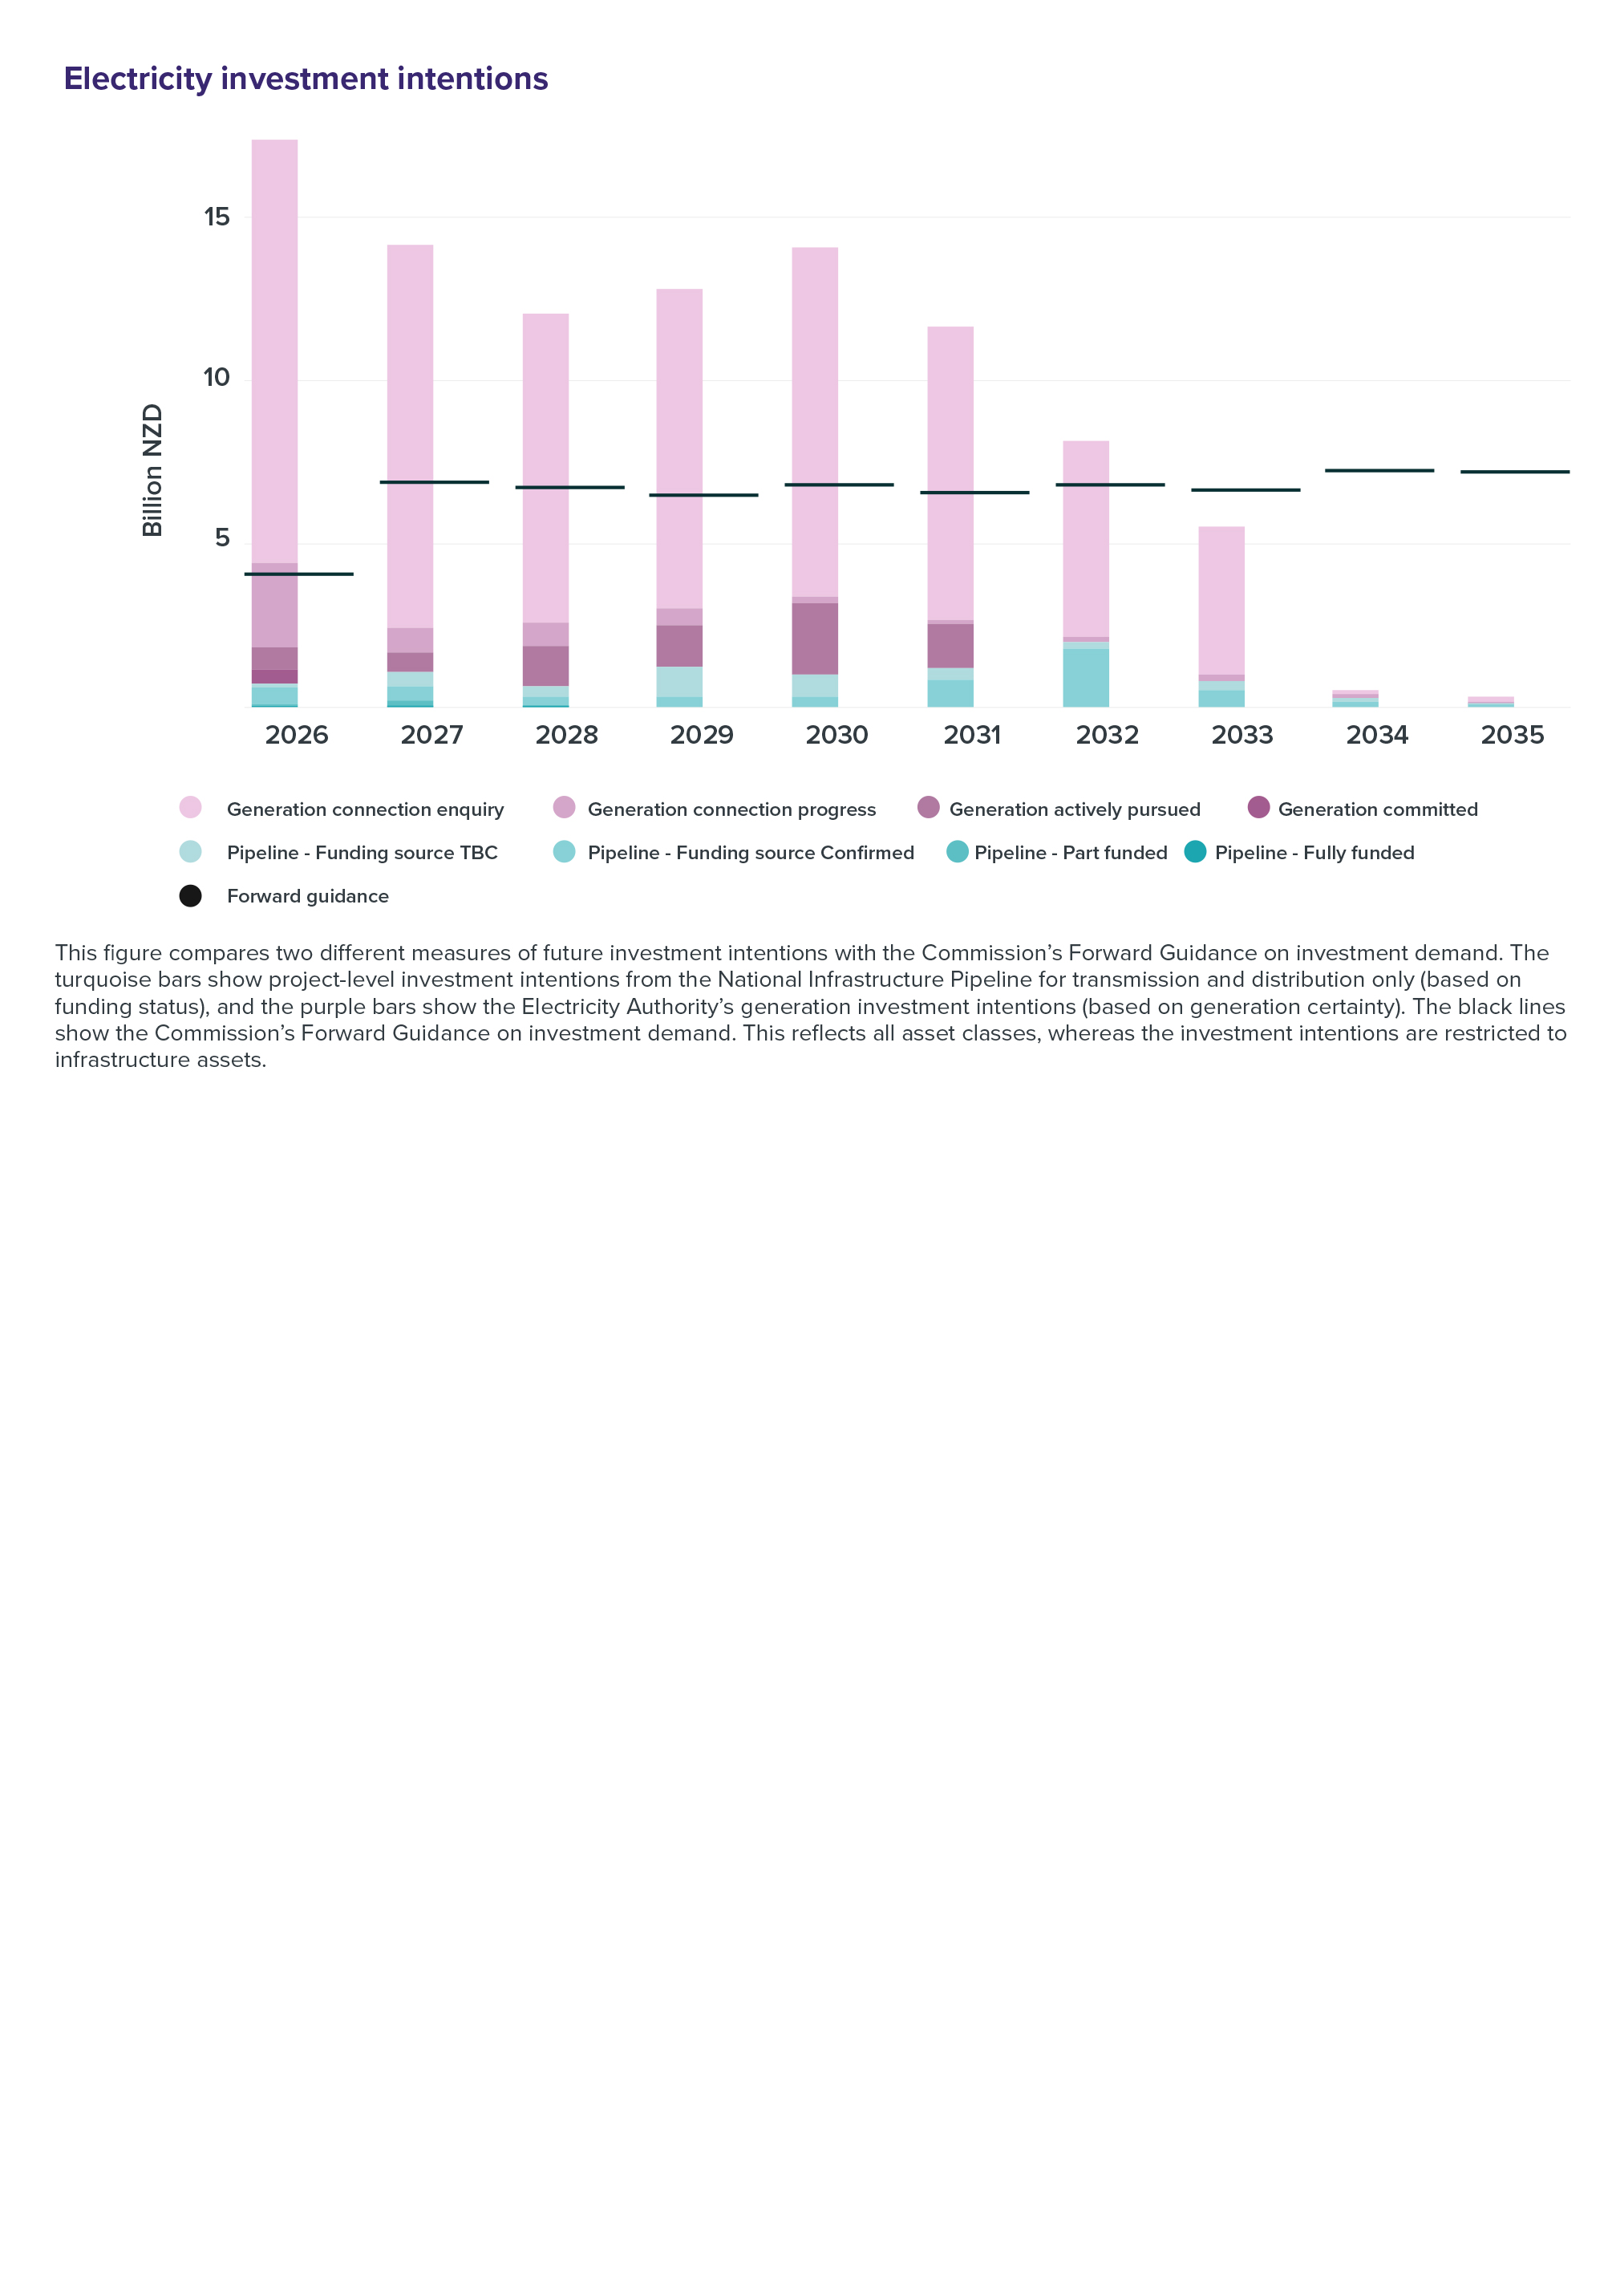
This table provides further detail on our Forward Guidance, which is summarised in Chapter 3. Further information on this analysis and the underlying modelling assumptions is provided in a supporting technical report.175
- Meeting our legislated net zero carbon emissions goals will require a meaningful uplift in electricity investment over the next 30 years. This investment will include a need for new electricity generation, transmission, distribution, and ‘firming’ generation to supplement variable renewables like wind and solar. Investment will also be required to improve the resilience of these systems. Investment in demand flexibility and distributed generation will play an increasing role in the future.
- Over a 30-year period, based on Climate Change Commission scenarios, we estimate that this decarbonisation demand, as well as demand for increased data centres, will require approximately $26 billion worth of capital investment above baseline demand driven by population and income growth, or just over $835 million a year on average. Most of this investment (90%) will be in new generation, and the remaining will be in the transmission and distribution network. Investment in technology and enabling systems to improve coordination and get more from our assets will be important.176
- Most of this decarbonisation-related investment demand is front-loaded in the next 10 to 15 years; however, we will also have to account for added renewal spending in the second half of the forecast period.
- Outside of decarbonisation efforts and technology-driven demand from data centres, we expect that investment in electricity networks will largely track the more subdued investment trends of the past 20 years. This is because other demand drivers such as population and economic growth are expected to be relatively modest, although resilience investment is likely to be an increasing focus.
3.7. Current investment intentions
- Electricity investment has been stable as a share of GDP in recent years, but current market information highlights that actual investment and future investment intentions are increasing. Increased investment will depend on market factors, including consumer demand for more electricity, expected return on investment over the lifetime of an asset, and policy factors like the consenting environment.
- Investment intentions submitted to the Pipeline largely reflect distribution and transmission networks. As a result, the Commission has worked with the Electricity Authority to include a view of generation investment intentions based on information received via their clause 2.16 investment pipeline information notice. This information is collected by Transpower as developers make enquiries about grid connection. Relative to current electricity generation capacity of around 10.6GW, a large amount of new capacity is being investigated – a total of 44.3GW as of October 2025. 1.38GW of this capacity is committed and 2.95GW is being actively pursued.
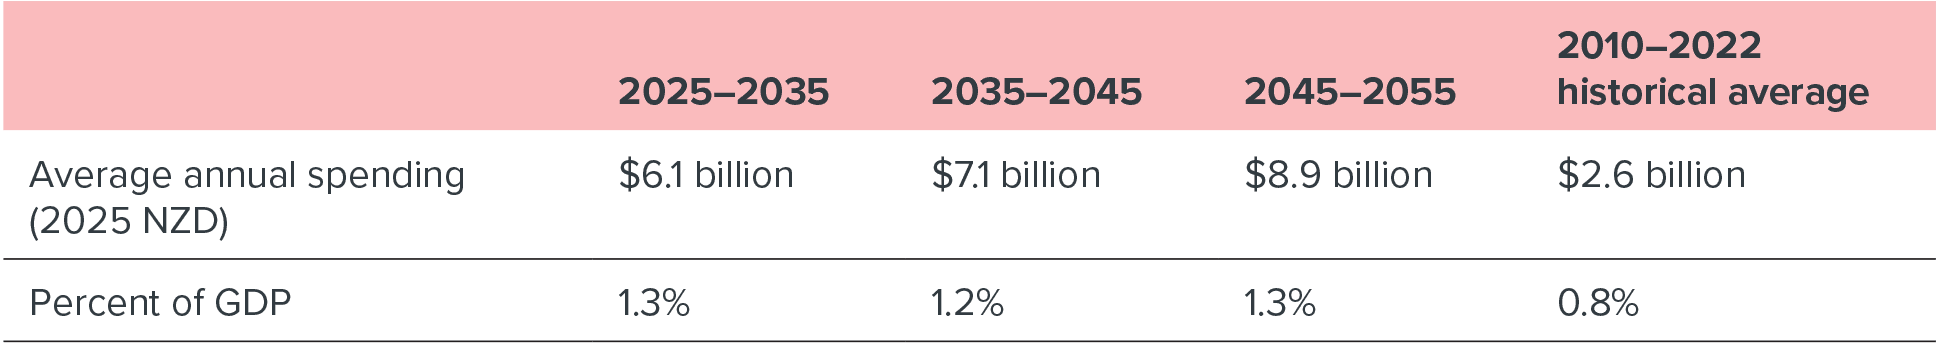
- The following figure shows that projected spending to deliver initiatives in planning and delivery in the Pipeline (turquoise bars) and the Electricity Authority’s generation investment intention information (purple bars) is expected to be significantly higher than the Commission’s investment demand outlook (black lines) in the next few years, but lower beyond this. This trend may not be surprising given the information is sourced from grid connection intentions information, and the lead time that businesses may reasonably engage with Transpower. Additionally, the information does not show historical investment intentions (that were not commissioned) moving forward, which is reasonable to anticipate as generation businesses make investment decisions. Investment in distributed generation including larger investments connected to local distribution networks is not represented in the chart.
Figure 48: Electricity investment intentions
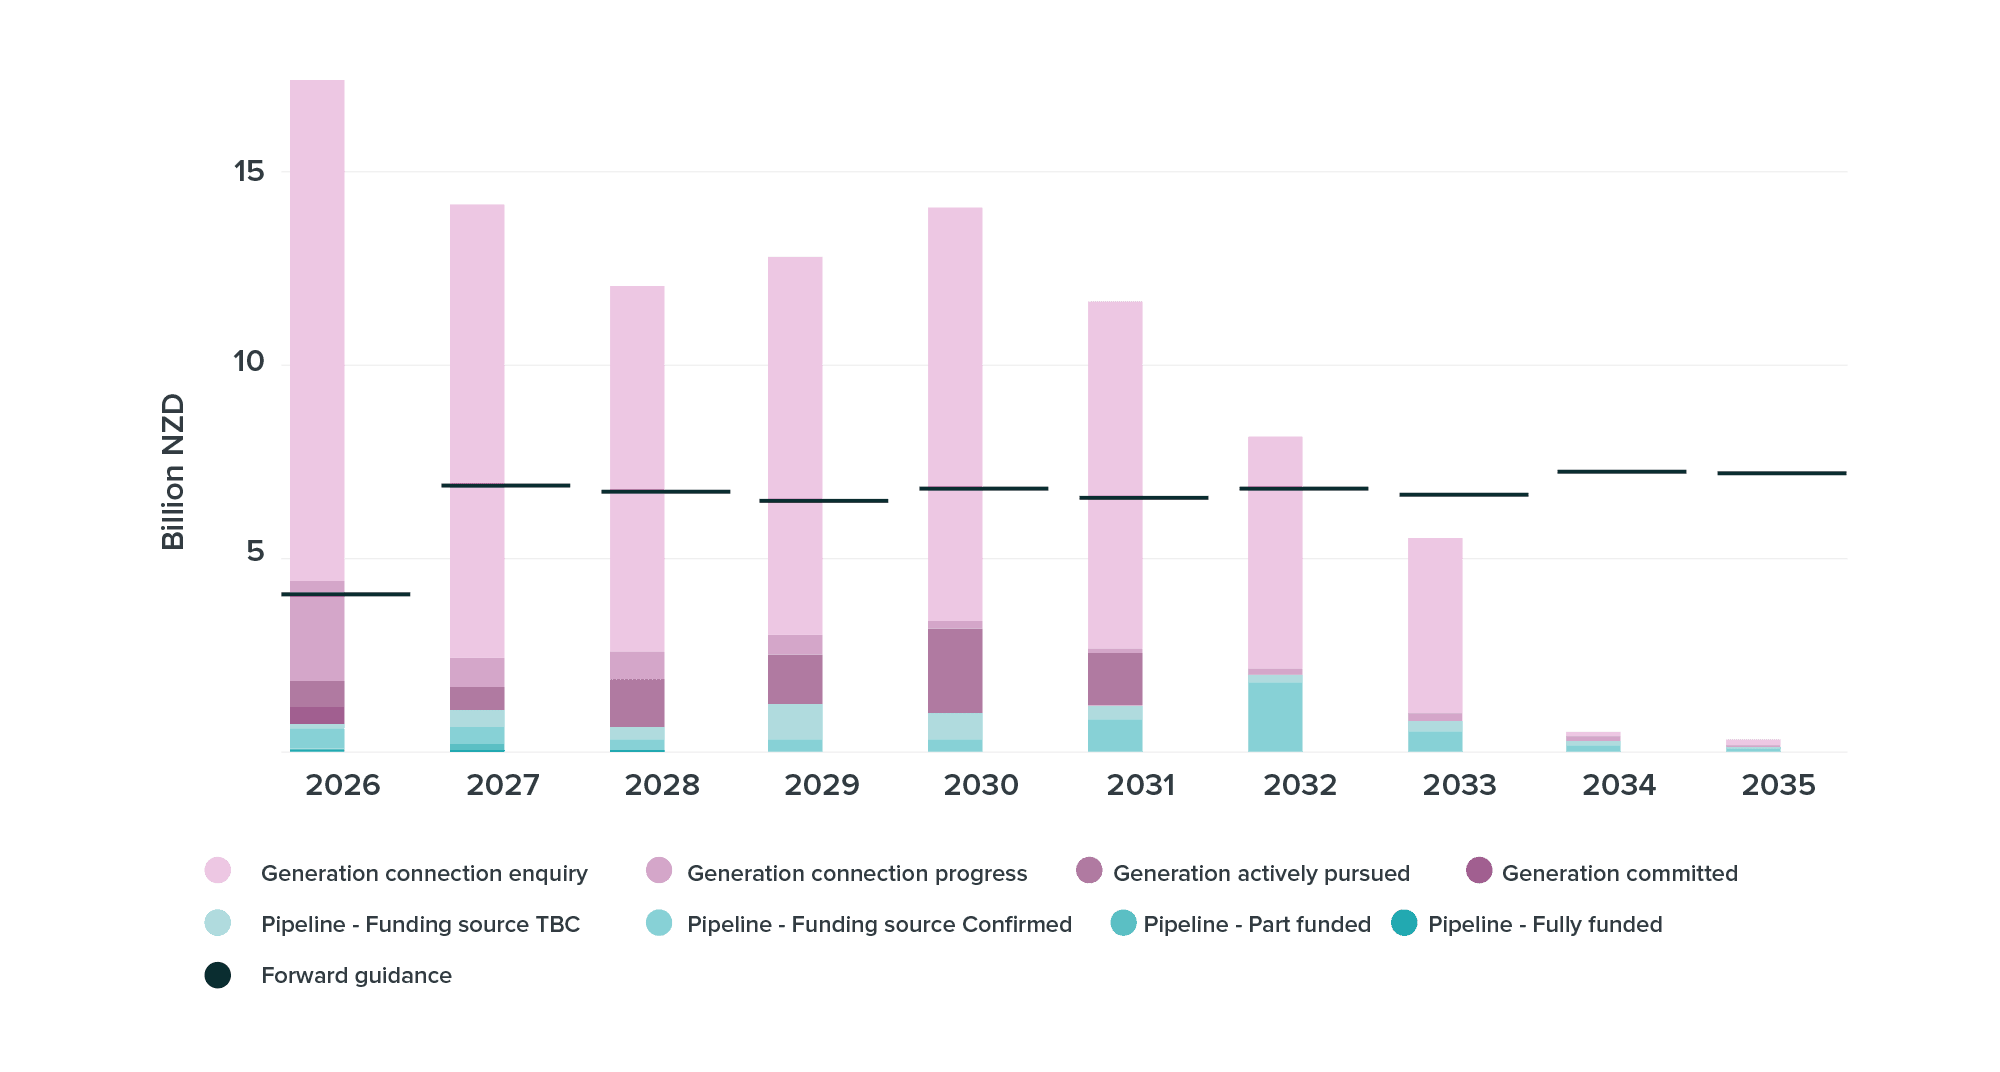
This figure uses two different measures of future investment intentions with the Commission’s Forward Guidance on investment demand. The turquoise bars show project-level investment intentions from the National Infrastructure Pipeline for transmission and distribution only (based on funding status), and the purple bars show the Electricity Authority’s generation investment intentions (based on generation certainty). The black lines show the Commission’s Forward Guidance on investment demand. This reflects all asset classes, whereas the investment intentions are restricted to infrastructure assets.
3.8. Key issues and opportunities
- Policy certainty: Policy uncertainty and unpredictability may continue to have an impact on future electricity demand. These include policies related to the implementation of the recent electricity market performance review, the Emissions Trading Scheme and other complementary decarbonisation policies, and the Government’s role in managing dry-year risk.
- Pricing: Wholesale pricing provides important signals for investment in generation, storage and demand response. The additional investment required by decarbonisation will put upward pressure on prices in the near-term, then decline as supply comes online and prices are driven by average cost. Consumers are also likely to benefit from spending less on petrol, diesel and gas for transport and heat, as electricity is often more efficient. Pricing approaches will need to consider investment risk and affordability for users during the transition period.
- Coordination: Electricity is expected to play a major role in meeting our 2050 legislated emissions goals, not only within the sector but by substituting for more carbon-intensive fuels. Coordination between increased investment in generation, transmission, distribution, demand response and distributed energy resources (for example, home solar and batteries) will be required. As investment in decentralised energy resources and demand flexibility expand, they will offer increasing value across the energy value chain, including the wholesale market, management of transmission and distribution networks, and customer services.
- Governance: While economic regulation has worked well for transmission and distribution providers, perceptions among the public indicate low confidence in prices reflecting costs. At a system level, there are issues that may be contributing to this, including regulatory coordination, reporting to the public, transparency of credible information around fuel availability, investment intentions, and market operation.
- Efficient resource consenting regimes: Accommodating new, more distributed generation and network assets will require responsive regulatory environments that acknowledge and enable investment and innovation.
- Navigating demand uncertainty: Timing of new supply with demand growth is a critical challenge for the sector. All published forecasts (MBIE, Climate Change Commission, BCG’s ‘The Future is Electric’ report, Transpower) point to accelerated demand growth. This growth is off the back of declining consumption since the Global Financial Crisis in 2008, led predominantly by large industrial processors (such as paper, wood, chemicals and basic metals), which makes the level and location of future demand harder to predict. Demand uncertainty is compounded by the pace of fuel switching from carbon-intensive industrial heat and processes, and the potential for demand growth from emerging industries, such as data centres.