Content
Content

2. Lots of projects, not enough money: New Zealand’s infrastructure ambitions
He huhua ngā kaupapa, he iti rawa te moni: Ngā whāinga tūāhanga awhero nui o Aotearoa
Summary
- The National Infrastructure Pipeline (the Pipeline) is New Zealand’s national dataset of infrastructure initiatives, capturing information on projects across the planning and delivery stages.
- The Pipeline, which is updated quarterly, has tracked 27,600 initiatives across their lifecycles, and grown to include 129 contributing organisations (including all major central government agencies, almost all councils, and many private providers).
- As of September 2025, the Pipeline – which assists with project coordination and sequencing – contained nearly 12,000 initiatives worth a combined $275 billion across every sector and region.
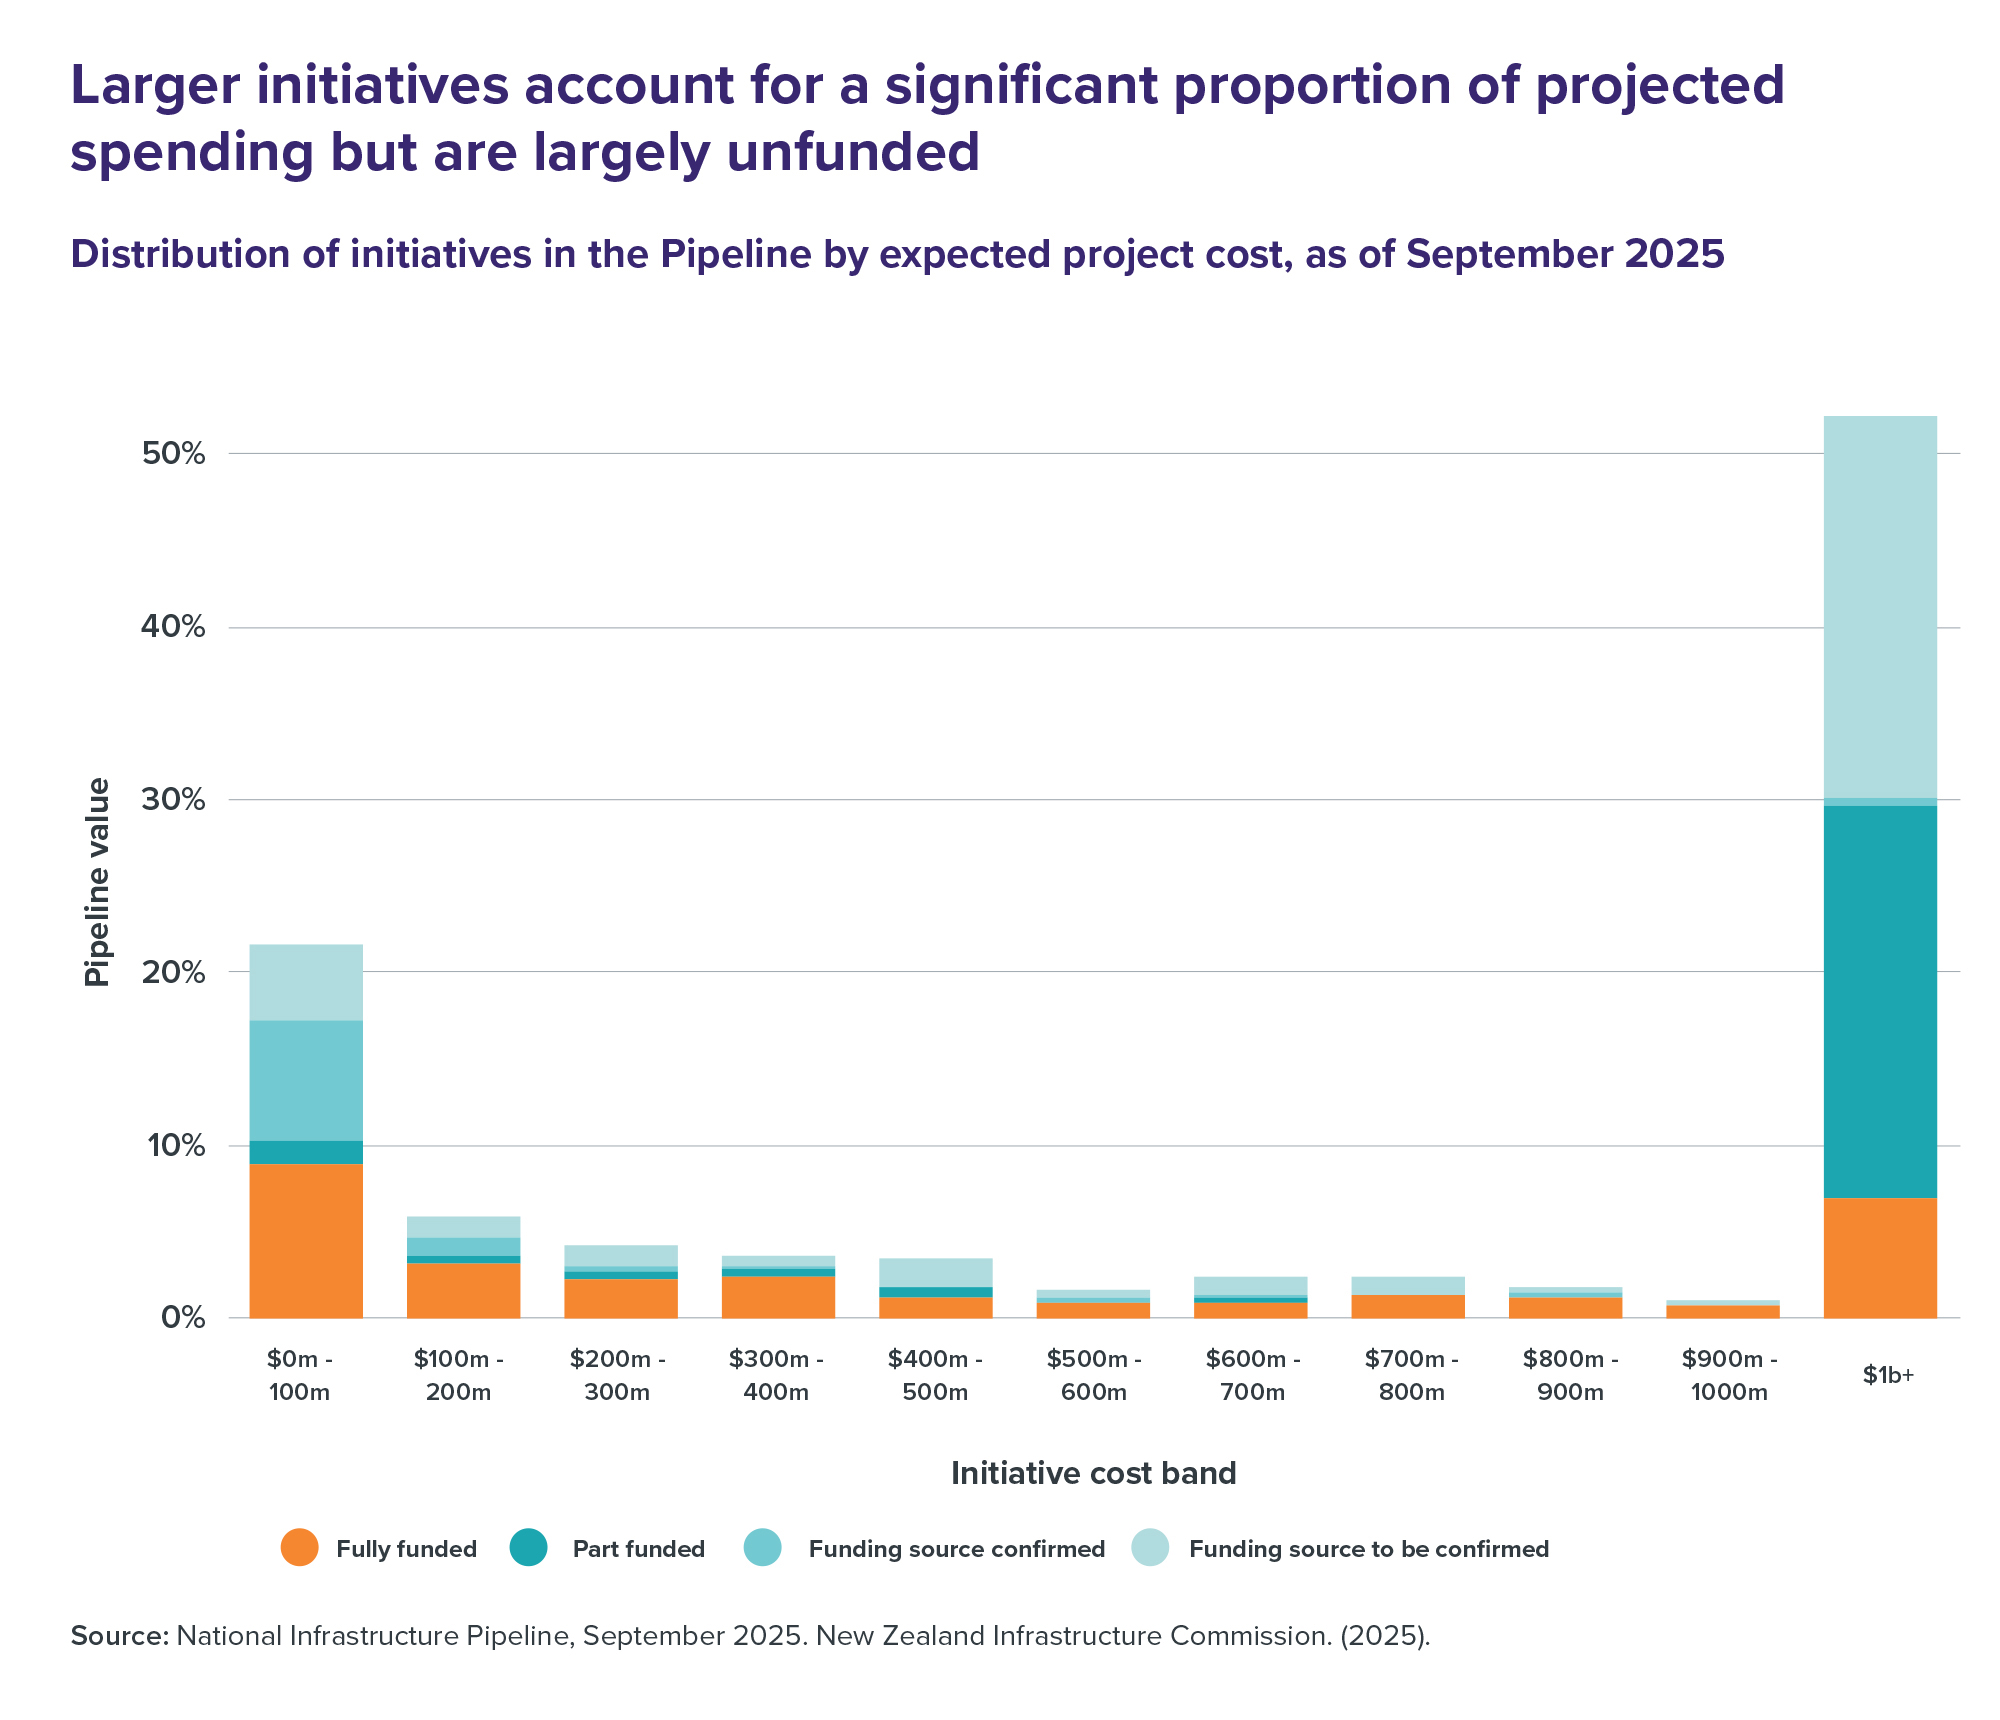
- Most initiatives are small: 96% of projects have an expected cost of under $50 million, and 98% are under $100 million. These projects account for 22% of the total value of the Pipeline, while 44 megaprojects with expected costs of more than $1 billion make up 52% of the total value.
- The Pipeline illustrates the magnitude of the choices in front of us and assists decision-makers to consider options for prioritising and sequencing investment options. More than two-thirds of initiatives by value ($193 billion out of $275 billion) are not yet fully funded, and many of these are large transport megaprojects.
The National Infrastructure Pipeline provides a system view of upcoming initiatives
Since 2020, the Commission has worked with public and private infrastructure providers to build a picture of infrastructure investment activity and lift transparency around upcoming projects. The National Infrastructure Pipeline has grown from 21 contributing organisations to 129, including all major central government agencies, almost all councils, and a significant share of private providers. As of September 2025, the Pipeline included information on nearly 12,000 initiatives in delivery and planning with a combined value of $275 billion. This makes it one of the most comprehensive project pipeline tools in the OECD, covering a greater share of activity in the market than similar tools in the UK, Ireland, and Australia.
The Pipeline shows infrastructure planning activity happening across the system, bringing together a forward view that spans every sector and region. By consolidating this information in one place, it enables the Government, infrastructure providers, the construction market, and investors to see what’s coming, coordinate planning and activity, build the right capability, and make better long-term choices. The Pipeline highlights the complexity of infrastructure planning and underscores the challenge of allocating limited resources efficiently.
Project funding commitments vary depending on project scale and the planning horizon. While discussion often centres on a handful of megaprojects worth more than $1 billion, most projects are smaller. Of the 12,000 initiatives in the Pipeline, 96% have an expected cost of less than $50 million, and 98% have an expected cost of less than $100 million. Together, these groups account for 22% of the total value of the Pipeline. At the other end of the scale, 44 megaprojects make up 52% of the total value (Figure 9). The smaller initiatives are less complex, have shorter planning horizons, and represent a higher proportion of committed funding by value than their larger and more complex counterparts.
Information in the Pipeline is constantly evolving and improving. The Pipeline has tracked 27,600 initiatives across their lifecycles. Project information is updated quarterly, offering a timely picture of activity to inform decisions and drive coordination across the system. Most change is observed with projects in the planning stages and ahead of funding commitments, which is the opportune time to consider how projects can be sequenced to improve delivery outcomes. As participation has grown and the capability of contributors has improved, the Pipeline has evolved to capture richer information on things like procurement and construction timeframes.
Pipeline data highlights trade-offs in funding decisions
Smaller initiatives provide a steady flow of work for the construction sector. These ‘bread and butter’ projects with expected costs under $100 million, like building a new classroom, upgrading an intersection or repairing a stopbank, are more likely to have confirmed funding sources and can often be delivered quickly. Their repeatable nature supports ongoing work programmes that build capability and productivity across the sector.
Many large projects in the Pipeline are not fully funded. Over two-thirds of the total value of projects in the Pipeline – $193 billion out of $275 billion – do not yet have full funding commitments. Most of this value comes from a small number of central government-led transport megaprojects worth more than $1 billion. Because of their scale, decisions about whether and when to fund them will shape what else we can afford to build. Even over multiple decades, it won’t be possible to build them all without significant repercussions.
Maintenance and renewal programmes remain under-represented. Only about 30% of the total value of the Pipeline relates to maintenance and renewal initiatives – lower than what we would expect given the size and age of New Zealand’s existing assets. This highlights that we may not be seeing all investment needs that require funding. This likely reflects how infrastructure providers plan and budget for maintenance and renewals.
We can’t pay for it all – we will have to choose
Long-term infrastructure planning requires more than lists of projects. Central and local government providers are looking ahead, but the full set of ambitions may not be affordable or deliverable without stronger prioritisation. Information in the Pipeline reinforces the need for prioritisation, coordination, and sequencing across providers and regions. Decision-makers need to take a wider system view to help balance trade-offs and make disciplined investment choices.
The National Infrastructure Plan aims to fix the front-end problems that prevent reliable long-term planning. This includes establishing a clearer view of funding requirements, embedding strong asset management and investment planning at the agency level, applying consistent assurance to prioritise the right projects, and clarifying how central government can support better outcomes across the system. Over time, better front-end planning can shift the balance in the Pipeline – leading to fewer speculative projects, and more well-prepared investments with clear funding paths.
Larger initiatives account for a significant proportion of projected spending but are largely unfunded
Figure 9: Distribution of initiatives in the Pipeline by expected project cost, as of September 2025

Source: National Infrastructure Pipeline, September 2025. New Zealand Infrastructure Commission. (2025).
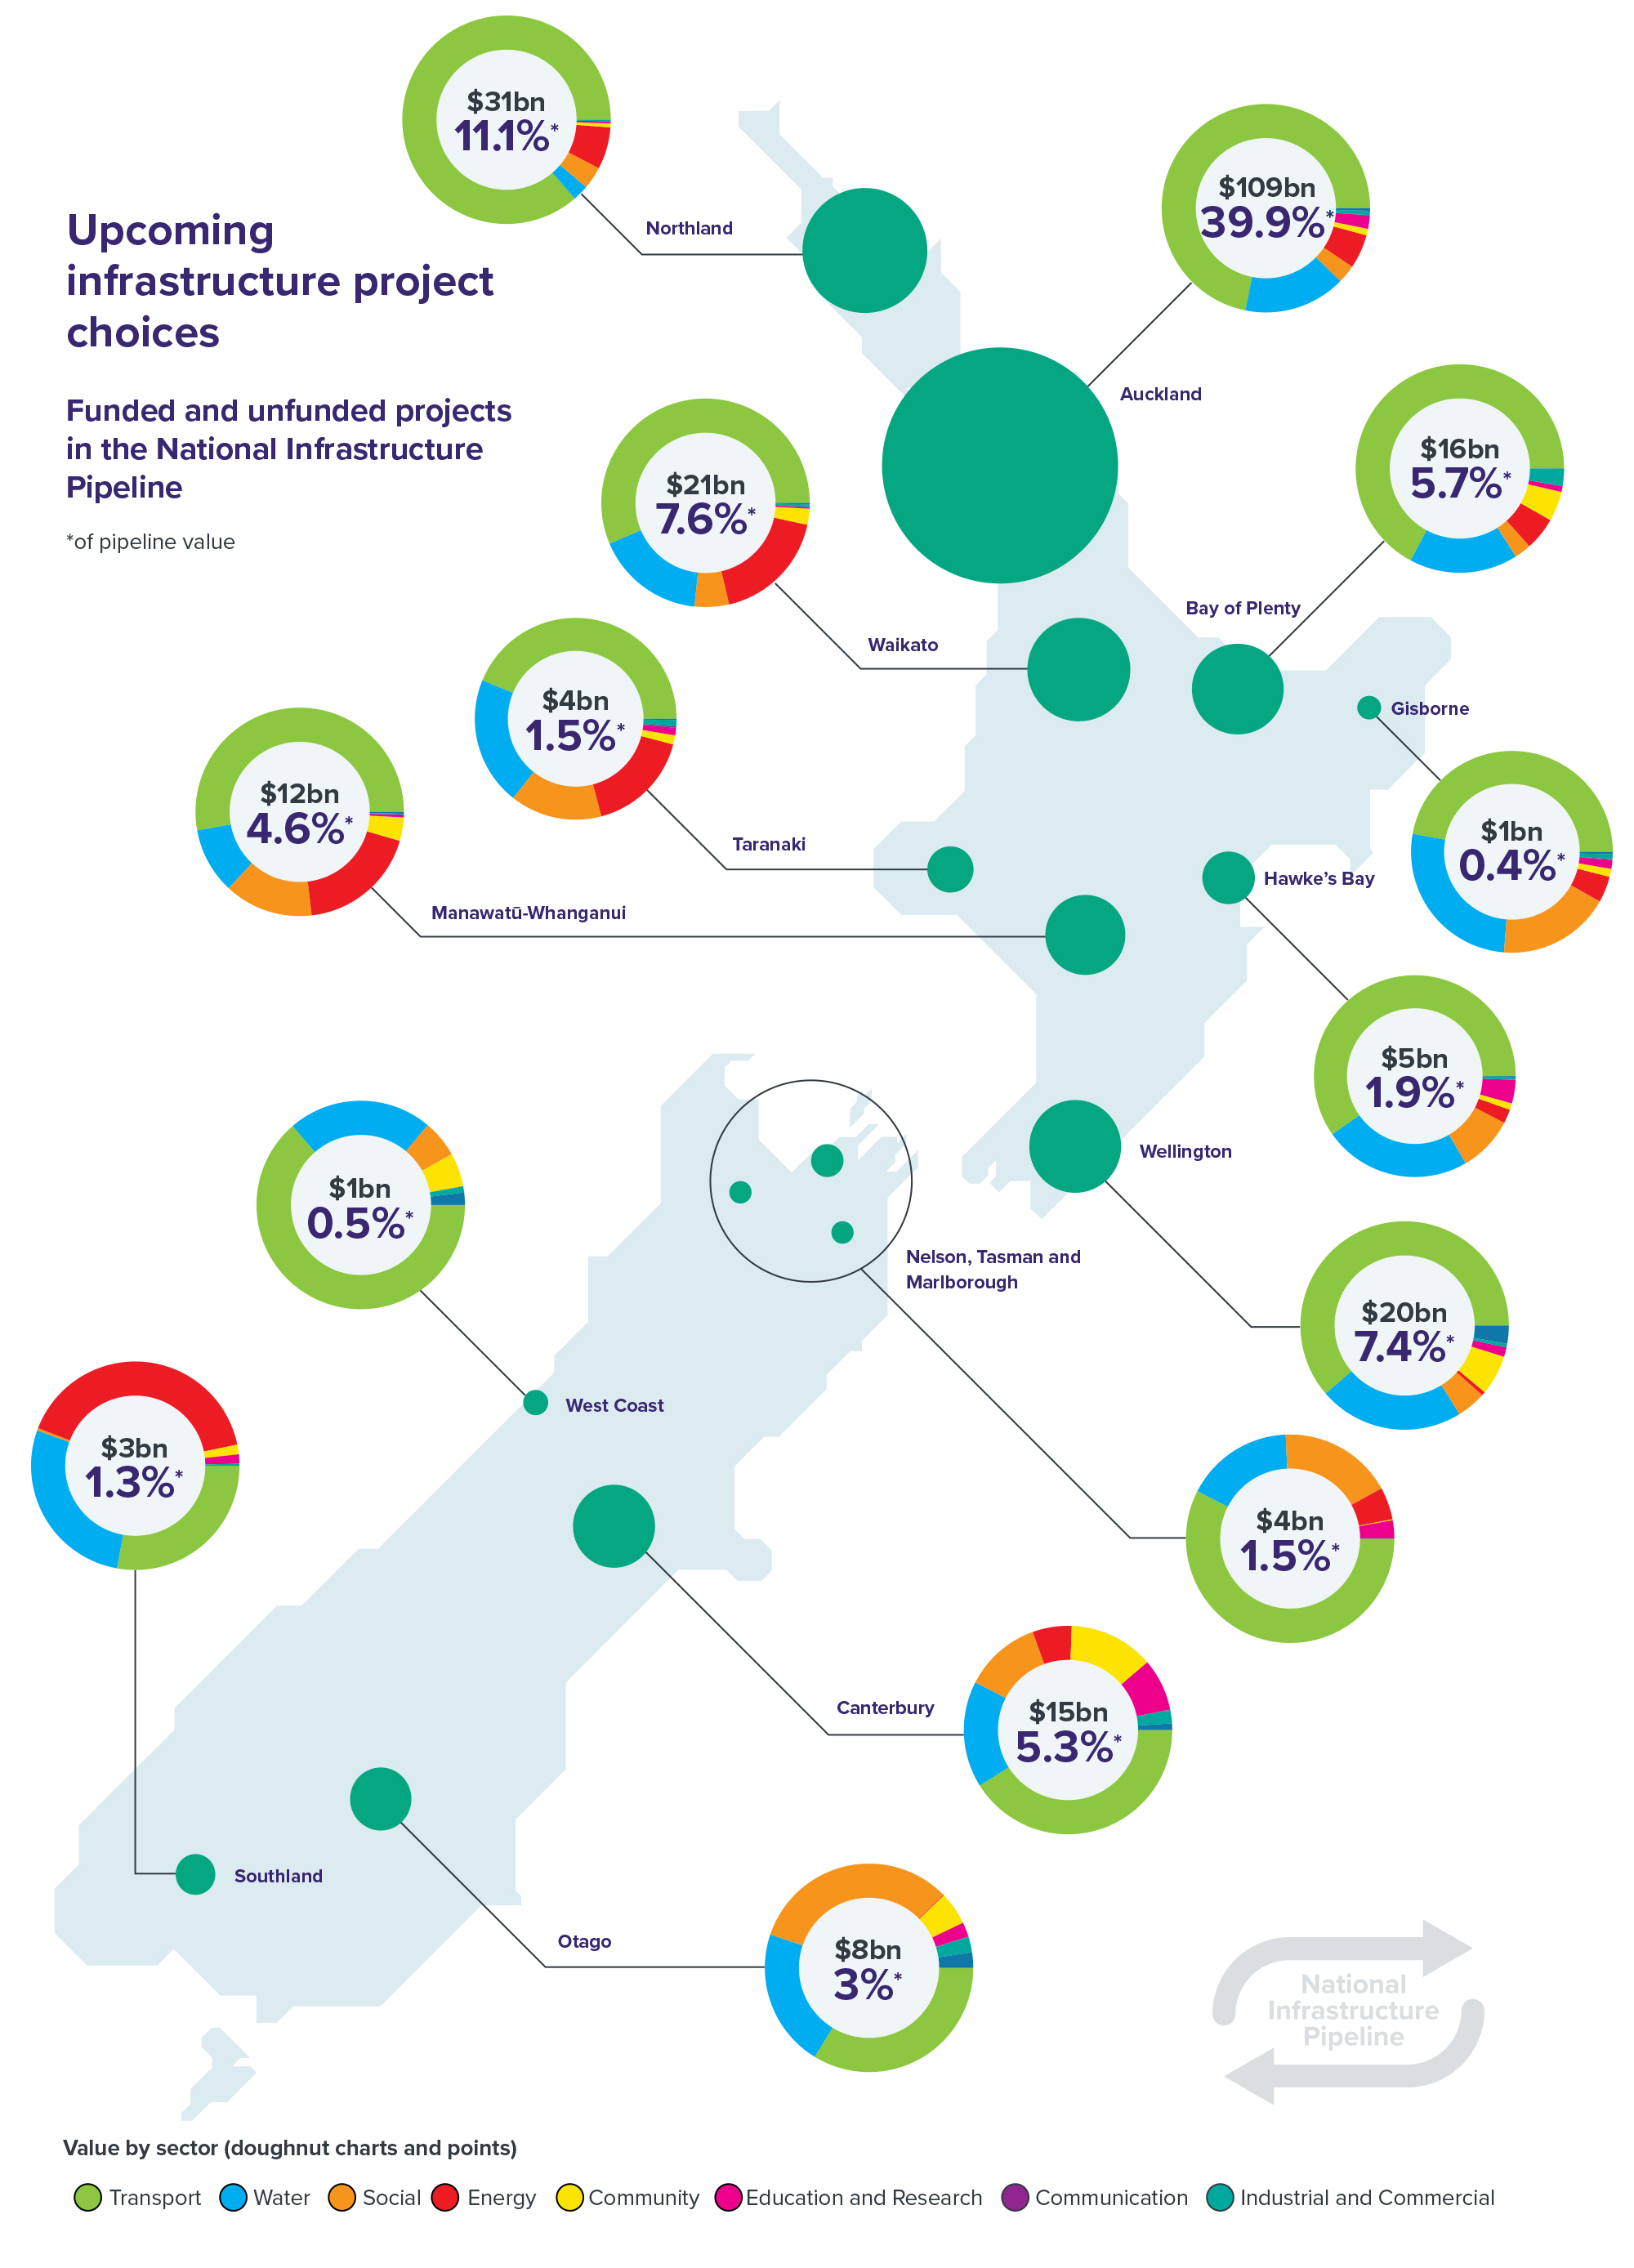
Upcoming infrastructure project choices
Figure 10: Funded and unfunded projects in the National infrastructure Pipeline

