Content
Content

Land transport
1.1. Institutional structure
Service delivery responsibilities
- Land transport infrastructure is primarily provided by ‘monopoly’ service providers, which are owned by central and local government.
- Land transport includes state highways (provided by the New Zealand Transport Agency Waka Kotahi (NZTA), a Crown entity), local roads and paths (provided by local road controlling authorities), local public transport services (planned and contracted by regional councils and Auckland Transport, with some routes provided by commercial entities) and rail (infrastructure, rolling stock, and freight and inter-regional passenger services) provided by KiwiRail, a central government state-owned enterprise.
Governance and oversight
- Road network operational oversight is provided by NZTA and local authorities. While NZTA provides a rail safety regulatory function, most rail oversight is provided from within the vertically integrated structure of KiwiRail, administered by its Board and accountable to the Minister.
- NZTA sets rules and standards for state highways, local roads, and walking, cycling, and public transport infrastructure and services. NZTA also manages the funding of the land transport system, and by extension, has considerable influence over the composition of New Zealand’s transport infrastructure projects.
- The NZTA Board makes independent decisions on which activities to include in the National Land Transport Programme but must give effect to direction and funding allocations in the Government Policy Statement on Land Transport (GPS-LT), which is set by the Government.
- The Ministry of Transport provides policy advice to the Government on the overall transport system, and it monitors the performance of NZTA, and closely engages with KiwiRail.
1.2. Paying for investment
- Historically, land transport has been funded through a combination of road user charges (RUC) and fuel excise duty (FED), which are paid into the National Land Transport Fund (NLTF), additional Crown funding, and fares and local government rates for public transit services. In recent years, delivering Government investment priorities for both road and rail infrastructure has required substantial Crown grants and loans in addition to user charges. Without changes to pricing or investment priorities, this fiscal gap is expected to continue.
- Setting aside direct Crown contributions, the NLTF, managed by NZTA, obtains revenues from FED, RUC, and vehicle and driver registration and licensing fees. These charges are set by Cabinet. Local authorities use rates, public transport fares and other transport charges to co-fund council road and public transport networks. NZTA’s Funding Assistant Rates (FAR) policy determines how NLTF revenue is used to co-invest together with councils in local projects.
- Guided by the GPS-LT, NZTA allocates funds from the NLTF across its nationally delivered activities and local transport initiatives put forward by councils.
- Rail networks are funded through a combination of NLTF revenues, Crown funding, rates, track user charges and farebox revenue. This includes contributions from councils and public transport users in Auckland and Wellington. While KiwiRail manages the entire national rail network, NLTF funding for the public transport activity class is used to help deliver metro services.
1.3. Historical investment drivers
- Investment in new transport networks is initially driven by technological innovations (for example, the invention of railways and cars), and then by improving connectivity and maintaining existing networks.
- As networks mature, maintaining and renewing existing assets becomes a major driver of spending. Road age and increasing network use, along with a change in traffic composition and natural hazard events, all influence maintenance and renewal spending demands.
- Once an extensive network is built, further improvements are driven by population growth (with investments concentrated in certain areas to relieve congestion), economic development (also concentrated), and rising level of service expectations among users.
- More recent freight and logistics developments include the utilisation of freight distribution hubs and inland ports, which scale and consolidate freight movements. These centres of concentrated freight activity require access to rail and road infrastructure, highlighting the complementary nature of private logistics investment with public investment in land transport.
1.4. Community perceptions and expectations
This section summarises what we know about the New Zealand public’s perceptions and expectations of the land transport sector at a national level.
-
There generally seems to be agreement that the performance of New Zealand’s land transport system is not always meeting New Zealanders’ expectations. However, views on how to improve performance and willingness to pay higher charges are more varied.152 Equity, accessibility, safety and ongoing service provision are major considerations.
-
Because transport costs are the largest infrastructure-related spending item in household budgets,153 changes in costs matter to consumers, particularly for fuel prices which feed into general cost-of-living concerns.154
-
In a nationally representative survey undertaken by the Commission as part of consultation on the draft National Infrastructure Plan, 55% of New Zealanders reported that the transport system meets or exceeds their needs, while 45% reported it somewhat or consistently fails to meet their needs.
1.5 Current state of network
New Zealand’s difference from comparator country average

Comparator countries: Canada, Columbia, Czechia, Finland, Iceland, Norway, Sweden (plus Japan and Spain for rail). Similarity based on income, population density, terrain ruggedness, urban populations, and coastal land area and heavy materials production for rail. Percentage differences from comparator country averages are based on a simple unweighted average of multiple measures for each outcome. Further information on these comparisons is available in a supporting technical report.155
-
New Zealand has an average-sized, sparsely used road network, which is also the case for our comparator countries. Across broad metrics of quality, we are about average, except for the safety of our roads, which have higher fatality rates than our peers.
-
The national rail network is characterised by a comparatively low level of investment and usage, even when comparing to countries with similar population density and geographical features. The length of our network is comparable with our peers (on both a per capita and land area basis), albeit with a lower level of electrification.
-
Preliminary analysis by the Commission suggests varied results for our metro rail networks (encompassing the Auckland and Wellington services) when comparing with similar cities. Wellington appears to outperform comparable jurisdictions in terms of usage, but in recent years has suffered on service quality.
-
The Commission also publishes performance dashboards that can be used to understand changes in the performance of New Zealand’s transport sector over time.156
1.6. Forward Guidance for capital investment demand
Land transport (roads, rail, public transport)

This table provides further detail on our Forward Guidance, which is summarised in Chapter 3. Further information on this analysis and the underlying modelling assumptions is provided in a supporting technical report.158
- Overall, slowing population and income growth are expected to put downward pressure on the population’s willingness to pay for significant expansions or quality improvements to land transport networks.
- Renewal needs will therefore make up the largest share of investment. Improving resilience to natural hazard events will add to this. Large investments in state highways during the 2010s will require future renewals during the forecast period.
- Similarly, with rail, renewal needs will drive growing investment requirements as a share of GDP. However, our modelling assumes that New Zealand will continue to operate a rail network as it does today, but since the 1950s we have slowly been reducing the size of the network.
- Capital intensive rail investment in recent years (such as the City Rail Link and parallel network improvements in Auckland) resulted in greater than average investment as a share of GDP. If these investments translate to ridership levels that exceed expectations, investment may continue at these levels to meet excess demand.
- Demand shifts associated with meeting legislated net zero carbon emissions pathways will also lead to a shift in the composition of investment demand. Climate Change Commission modelling for the Fourth Emissions Budget suggests that this will lead to a shift in travel demand from private vehicle travel to public transport and active modes, even after accounting for increased electric vehicle usage. Roughly speaking, this will offset expected road demand growth from population and income growth. This will lead to increased demand for public transport infrastructure investment and reduced demand for road capacity investment, primarily for state highways which have historically been more responsive to increased private vehicle demand. The above figures include the net impact of these two shifts.
1.7. Current investment intentions
- Investment intentions significantly exceed demand as estimated in our Forward Guidance. The Commission’s Forward Guidance is designed to be a long-run view of investment sustainability for the country. The scale of future investment intentions raises questions about a misalignment between investment plans and user willingness to pay, and could pose affordability issues in the long term.
- Road and rail investment has risen in recent years. It is expected to continue rising, based on infrastructure providers’ project intentions and programme-level investment intentions.
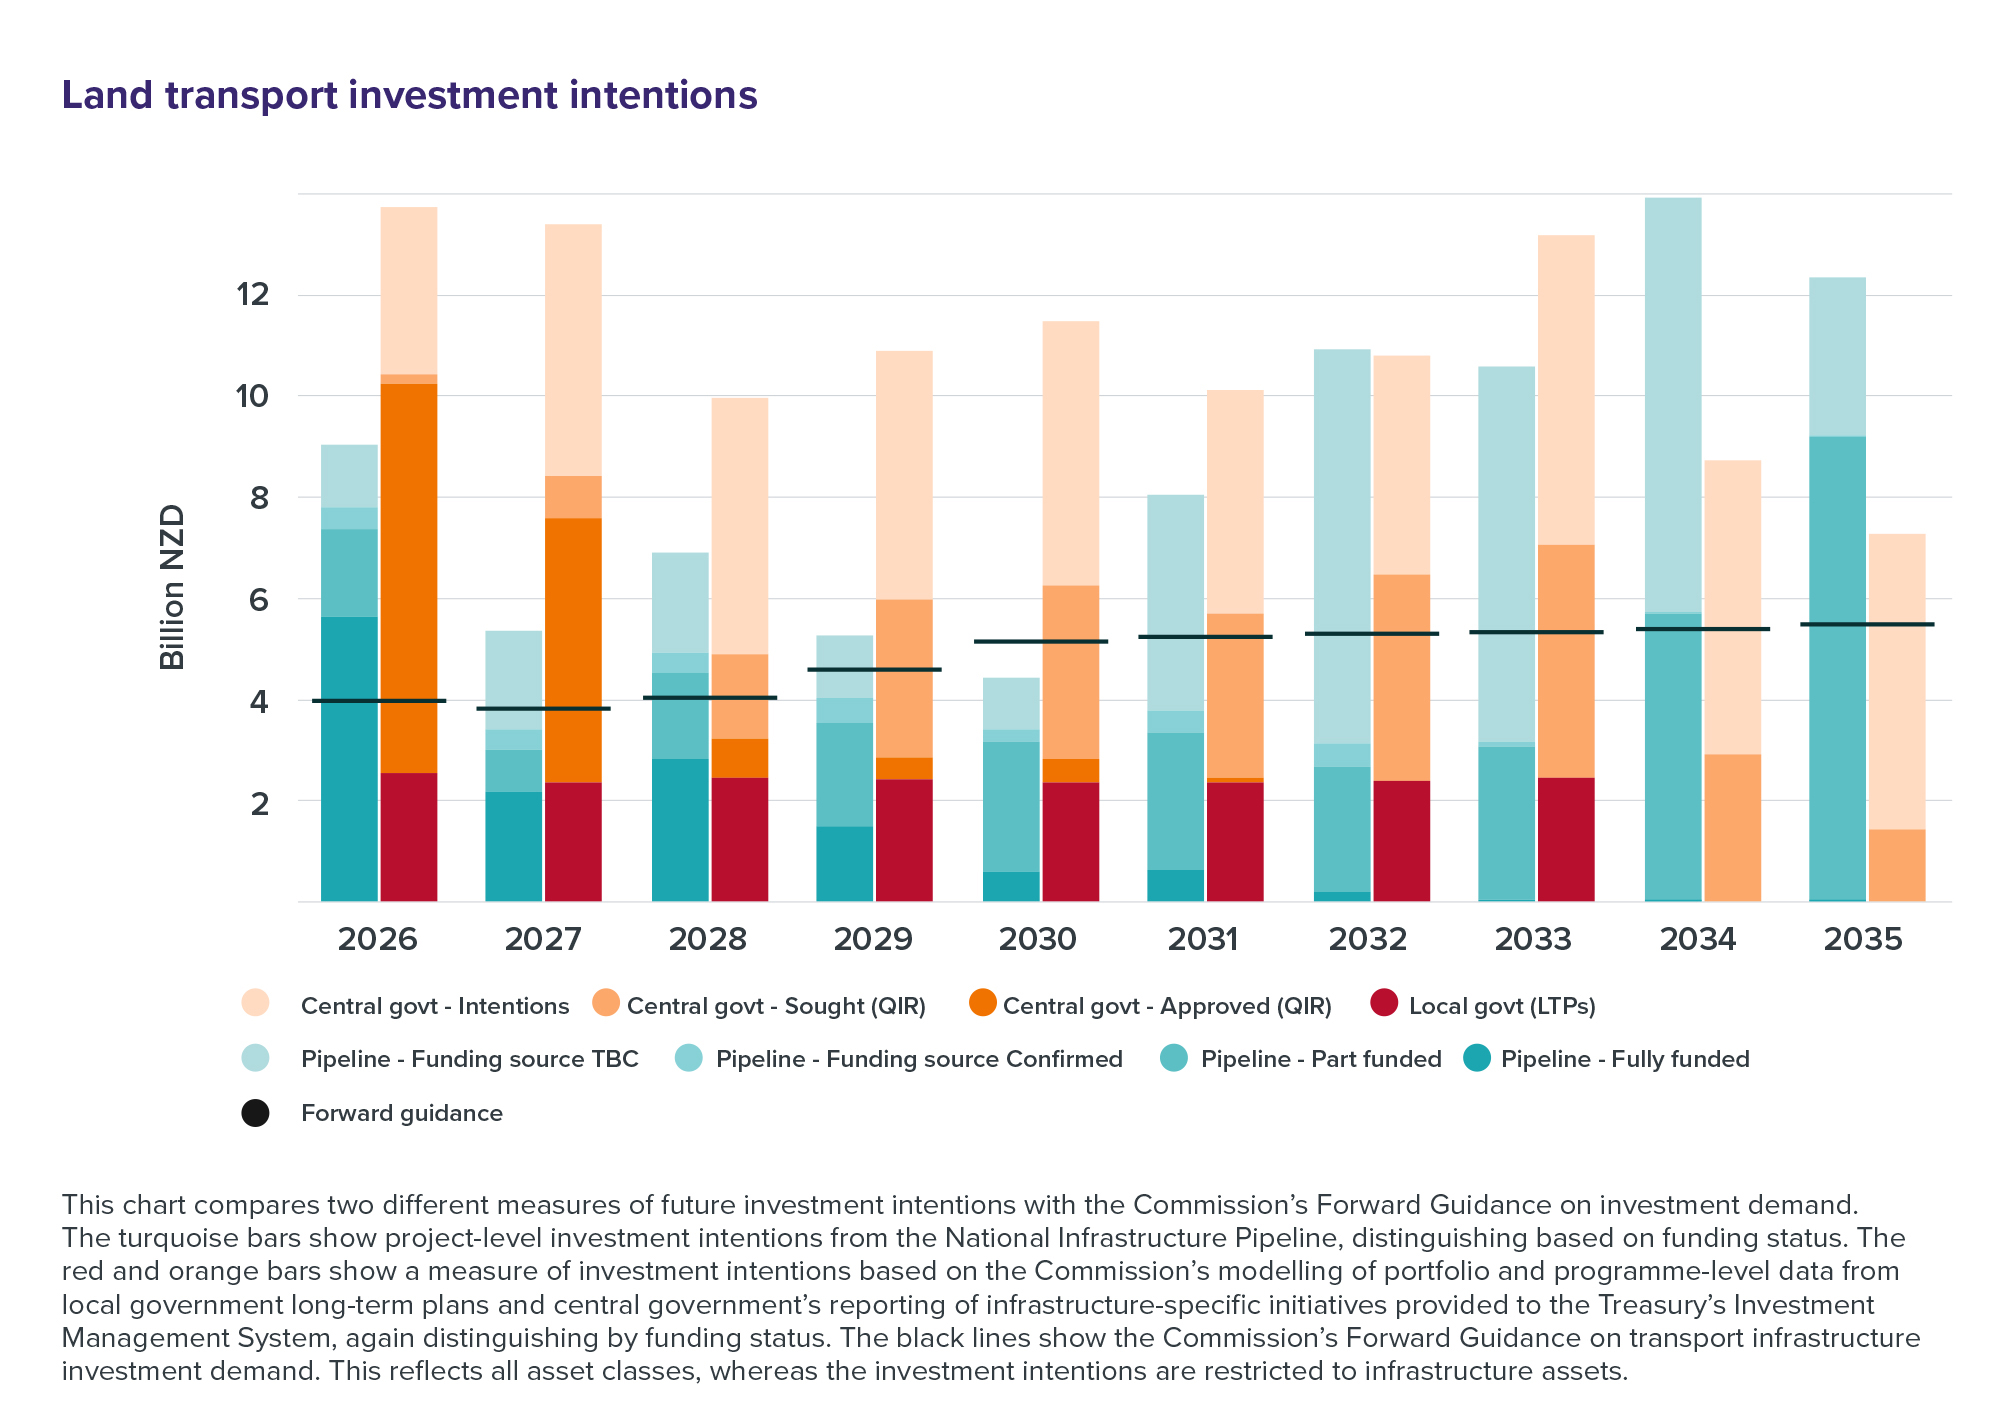
- The following chart shows that projected spending to deliver initiatives in planning and delivery in the National Infrastructure Pipeline (turquoise bars) and programme-level intentions in local government long-term plans and central government’s reporting to the Treasury’s Investment Management System (red and orange bars) are significantly higher than the Commission’s investment demand outlook (black lines) over the 2026–2035 period.
- A large share of investment intentions reported to the Treasury and shown in later years in the Pipeline are currently unfunded.
Figure 46: Land transport investment intentions

This chart compares two different measures of future investment intentions with the Commission’s Forward Guidance on investment demand. The turquoise bars show project-level investment intentions from the National Infrastructure Pipeline, distinguishing based on funding status. The red and orange bars show a measure of investment intentions based on the Commission’s modelling of portfolio and programme-level data from local government long-term plans and central government’s reporting of infrastructure-specific initiatives provided to the Treasury’s Investment Management System, again distinguishing by funding status. The black lines show the Commission’s Forward Guidance on transport infrastructure investment demand. This reflects all asset classes, whereas the investment intentions are restricted to infrastructure assets.
1.8. Key issues and opportunities
- Pricing and governance: The National Infrastructure Plan recommends that transport network infrastructure should be predominantly funded from user charges, because most benefits flow to current users. However, current investment intentions significantly exceed revenue from user charges, with the difference funded by Crown grants and loans. This suggests that investment intentions exceed the willingness of beneficiaries to pay for investment, raising questions about the value for money of this investment. Additional pricing mechanisms, such as tolling and congestion charging, could be used to manage congestion and demand for new capacity in the face of uncertain income and population growth. The Commission’s Forward Guidance could assist with long-run affordability by outlining a sustainable level and mix of land transport investment, aiding price setting and investment planning.
- Improved coordination: Spatial planning done well can help identify where transport infrastructure is required to support urban growth and regional development. Spatial planning is also important for maximising the benefits of investment in transport when paired with technology and travel demand initiatives, while managing network adaptation to climate change impacts.
- Policy and investment: Consistent priorities for land transport investment could help local government to deliver their own investment plans and the construction industry to deliver. Government policy approaches for meeting emissions goals will have an impact on the sector by affecting the mix of investment in different modes of transport.
- Project appraisal: In recent decades, the cost-benefit ratios of funded transport projects have declined as other factors, such as alignment with Government objectives, have taken priority. Research evaluating completed New Zealand transport projects found that benefits tend to be overestimated in initial appraisals and costs underestimated. There is a role for strengthened project appraisal prior to investment decisions.