Content
Content

Telecommunications
5.1. Institutional structure
Service delivery responsibilities
- The telecommunications sector includes fixed-line telecommunications services (both voice and data services, provided by fibre broadband and a legacy copper telecommunications network), mobile telecommunications services (both voice and data services), fixed wireless access (FWA), and other services like satellite broadband.
- Fixed-line broadband infrastructure is monopolistic, but there are many retailers of fibre broadband services to households.
- A wholesale/retail structural separation applies to Chorus’ fibre broadband services and retail restrictions are placed on local fibre companies (LFCs). Other fixed-line broadband infrastructure, such as Hybrid Fibre Coaxial (HFC), is not subject to the same restrictions.
- Cellular Wireless (Mobile) services are competitive, with several firms offering services. Supporting cellular wireless are tower companies, such as Connexa and FortySouth, which provide the ground infrastructure (masts) for the wireless telecommunications equipment.
Governance and oversight
The Commerce Commission regulates terms of access across a range of telecommunications services and collects information on service provision and pricing throughout the sector.
- Price regulation is restricted to fibre ‘anchor’ services (voice and broadband) and some legacy wholesale access pricing (copper and mobile termination rates).
- MBIE provides strategy and policy advice on communications markets and administers the telecommunications levies.
5.2. Paying for investment
- Telecommunications infrastructure is largely customer funded. Overall costs of providing telecommunications services should be passed through to customers. However, central government has provided financing, and in some cases grant funding, for some infrastructure initiatives.
- Since 2010, the Government has invested around $2.6 billion in connectivity infrastructure, including $1.8 billion in loans to support the rollout of Ultra-Fast Broadband (UFB) and more than $770 million in grant funding for rural connectivity infrastructure in areas where services may not otherwise be commercially feasible to provide. It has also invested $1.4 billion in the Public Safety Network used by emergency services.
- Pricing arrangements include regulated revenue caps for monopoly segments of the market (set by the Commerce Commission), but other than this, providers have flexibility about pricing structures.
5.3. Historical investment drivers
- In recent decades, spending has been driven by the need to deploy new telecommunications technologies (mobile networks, internet) and respond to technology-driven increases in demand.
- Measured depreciation rates are high, reflecting the high rate of technological obsolescence in the sector. Legacy assets tend to be replaced with new technologies rather than renewed on a like-for-like basis. However, for other physical assets, such as in-ground ducting and poles, depreciation rates are lower and reflect long-lived assets.
5.4. Community perceptions and expectations
This section summarises what we know about the New Zealand public’s perceptions and expectations of the telecommunications sector, at a national level.
- In general, telecommunications services in New Zealand appear to be meeting most New Zealanders’ expectations.185
- In a nationally representative survey undertaken by the Commission as part of consultation on the draft National Infrastructure:
- 90% of New Zealanders reported that mobile phone services meet or exceed their needs, while 10% reported it somewhat or consistently fails to meet their needs.
- 85% of New Zealanders reported that internet services meet or exceed their needs, while 15% reported it somewhat or consistently fails to meet their needs.
5.5. Current state of network
New Zealand’s difference from benchmark country average

Comparator countries: Canada, Chile, Columbia, Costa Rica, Finland, Iceland, Norway, and Sweden. Similarity based on income, population density, terrain ruggedness, total population, urban population. Percentage differences from comparator country averages are based on a simple unweighted average of multiple measures for each outcome. Further information on these comparisons is available in a supporting technical report.186
- Over the past 10 years, New Zealand has spent a larger share of GDP on telecommunications infrastructure than most comparator countries. Demand for data services has increased significantly within this time, and providers have been responding by adding additional capacity and speed enhancements.
- New Zealand’s fixed broadband network is comparable to our comparator countries in terms of network coverage, subscriptions, and quality (connection speeds). New Zealand ranks tenth in the OECD for fibre uptake, although this position has slipped since completion of the UFB programme as other OECD countries, including our comparators, have continued to invest in digital networks.
- New Zealand’s uptake of mobile subscriptions is comparable to similar countries, and 4G mobile broadband coverage is like that of comparator countries, albeit at the lower end of the range. However, only around 40% of the population is covered by 5G mobile networks, which is nearly the lowest in the OECD and well below other comparator countries. This could be due to delays in spectrum being allocated, as the 2020 auction was cancelled due to the COVID-19 pandemic.187 New Zealanders also use a very low amount of mobile data compared to our peers, although mobile data usage is growing rapidly.
- The Commission publishes performance dashboards that can be used to understand changes in the performance of New Zealand’s telecommunications sector over time.188
5.6. Forward Guidance for capital investment demand
Forecast investment levels for telecommunications

This table provides further detail on our Forward Guidance, which is summarised in Chapter 3. Further information on this analysis and the underlying modelling assumptions is provided in a supporting technical report.189 Our analysis for the telecommunication sector includes investment in all fixed assets to service the sector. This includes assets such as fibre cables and towers but also includes data processing and storage facilities. Underlying data is drawn from Stats NZ National Accounts data on asset values.
- The telecommunications sector is characterised by technological innovations leading to rapid deployments of new networks and retirements of existing technologies. This rapid technological progress makes forecasting investment demand challenging.
- Innovations in artificial intelligence and mobile phone technologies suggest that technology will continue to drive elevated investment in the sector.
- The sector has been in an investment boom since the 1980s, although peak levels of investment occurred in the 1990s and early 2000s. High depreciation rates in telecommunications suggest that renewal or replacement of the existing network will continue to drive investment after this period of high investment.
5.7. Current investment intentions
- The Pipeline’s information on telecommunications investment underrepresents the investment occurring in the sector. Private sector providers are encouraged to contribute information on their initiatives in planning and delivery. Based upon information from Stats NZ, this figure could be between $2 and $3 billion per year.
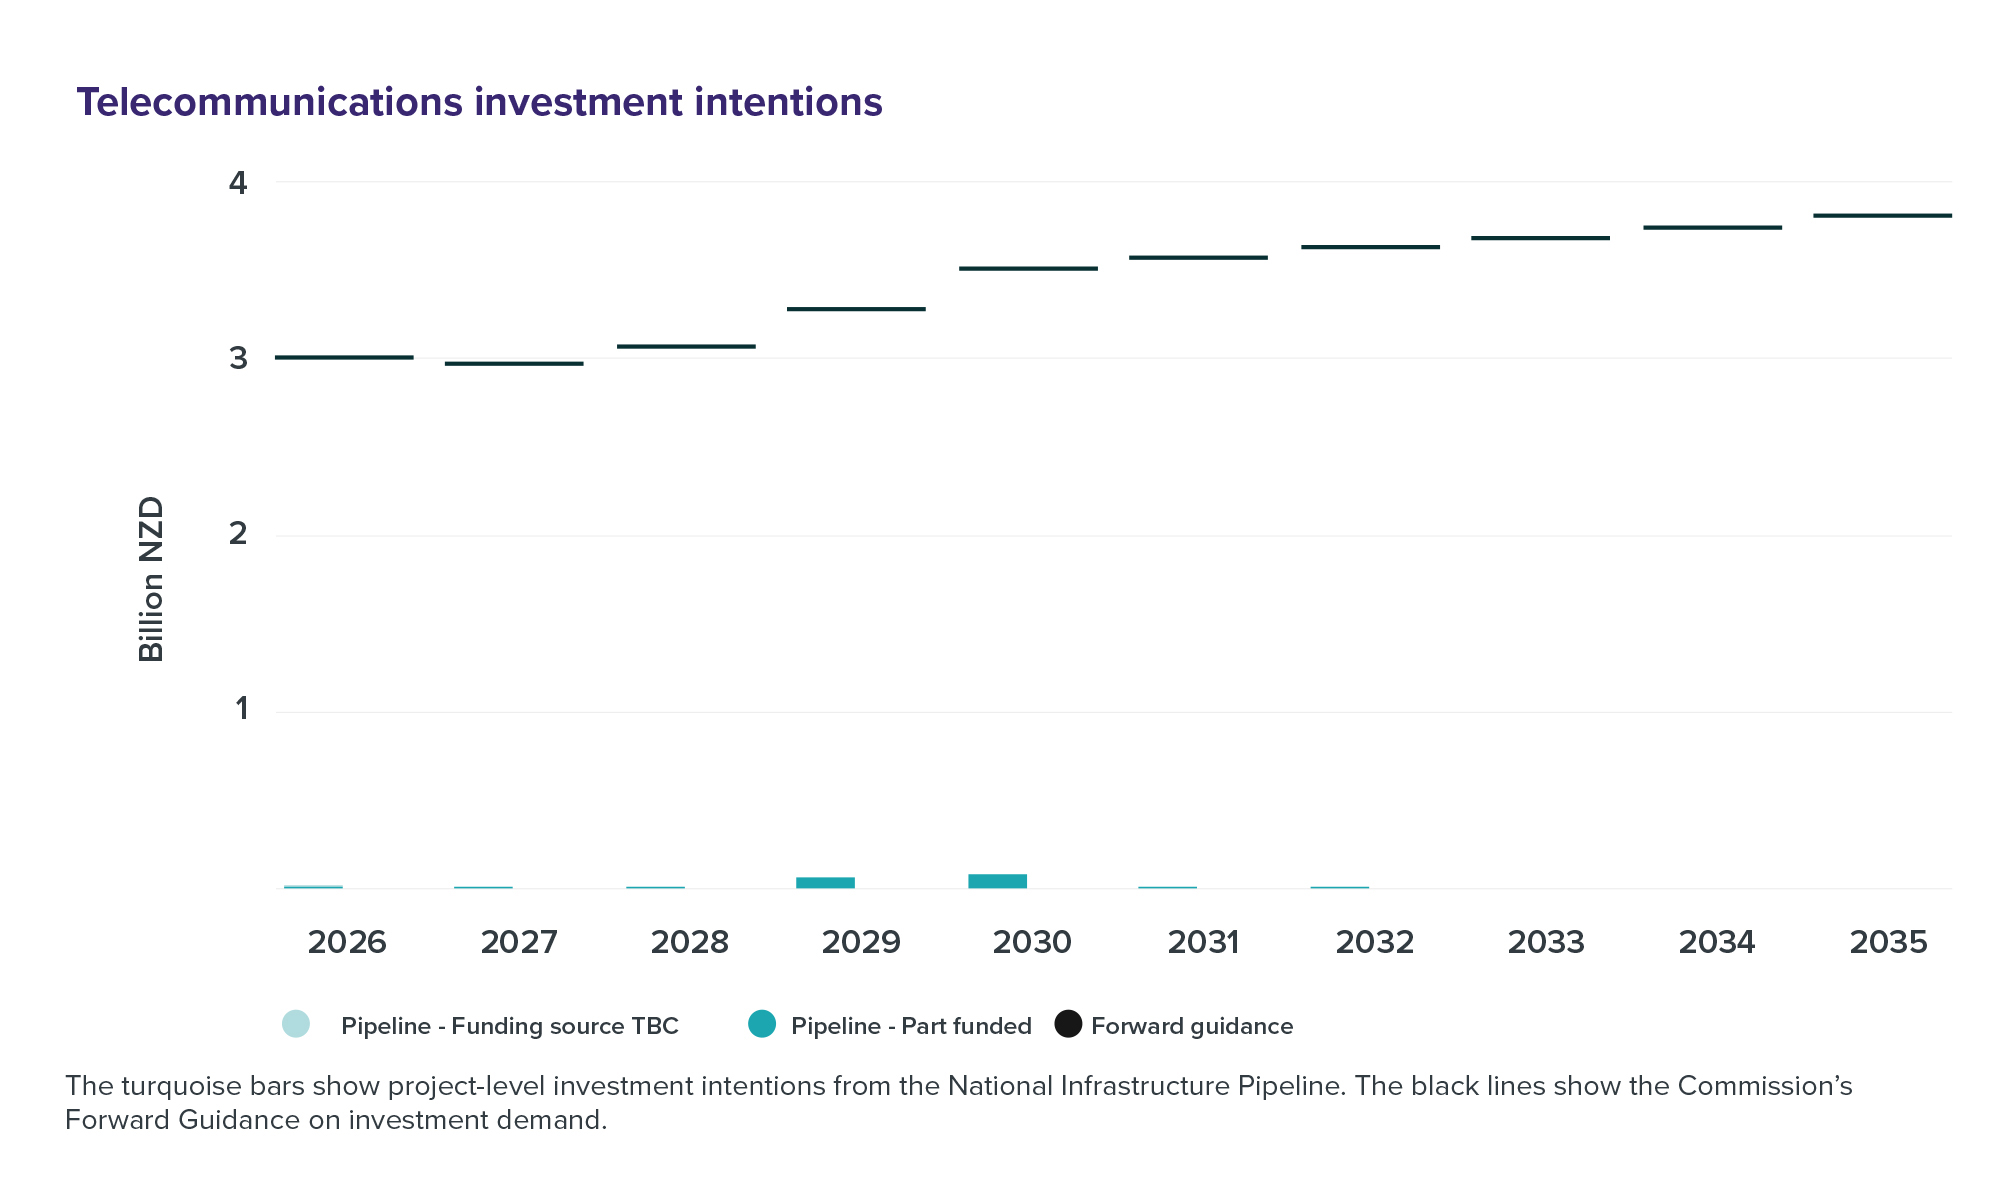
- The following chart shows that projected spending to deliver initiatives in planning and delivery in the Pipeline (turquoise bars) is significantly below the Commission’s investment demand outlook (black lines) over the 2026–2035 period. This is due to limited Pipeline contributions by the commercial entities responsible for telecommunications investment.
- The Commission’s Forward Guidance, which is based upon Stats NZ’s capital investment data, suggests slowly rising investment demand that is broadly in line with economic growth.
Figure 50: Telecommunications investment intentions

The turquoise bars show project-level investment intentions from the National Infrastructure Pipeline. The black lines show the Commission’s Forward Guidance on investment demand.
5.8. Key issues and opportunities
- Rural telecommunications access: 13% of homes are not connected to fibre broadband. The migration to newer technologies and increasing community expectations will increase demand for a mix of fibre, wireless (FWA), and satellite technologies to provide modern telecommunications services to customers not currently served by the fibre network. Some responders to the draft National Infrastructure Plan noted the difficulty and time taken to obtain resource consents for new infrastructure in rural areas. Funding and financing infrastructure expansion to these areas will remain challenging for commercial providers, particularly if ensuring equal access to these technologies is a priority.
- Governance and regulation: New Zealand has many service providers, indicating competition in access for consumers and businesses. However, OECD surveys into regulation in the sector have highlighted potential gaps related to competition in the sector and scope of regulation (only Chorus is price-quality regulated, while LFCs are subject to information disclosure) and relative separation of the Commerce Commission from Government priorities. Industry feedback on the draft National Infrastructure Plan indicates the importance of access to radio masts and new sites for masts, as well as spectrum allocation to foster greater growth in wireless technologies.
- Transparency and information: There are some publicly available or centralised sources of information on the condition of telecommunications assets. Chorus and LFCs publish reasonably thorough asset age and health information (although still short of full asset management plans like electricity and gas). As mobile and other network assets are subject to less economic regulation, there is less publicly available information on asset condition. There is also comparatively little research on the vulnerability of New Zealand’s telecommunications assets to natural hazard risk.
- Technological advancement: Keeping pace with technological advancement in information technology will be a continual challenge for telecommunications providers. Despite New Zealand’s very low 5G coverage and low rates of mobile data usage, community perceptions of telecommunications infrastructure are high. This suggests New Zealand’s fibre and 4G networks are meeting the expectations of the community. However, advancements in technologies that require fast mobile communications may increase demand for 5G, and New Zealand’s slow start to 5G deployment may act as a bottleneck to the uptake of such technologies.
- Coordination: Feedback on the draft National Infrastructure Plan suggested that there may be an issue around some networks peering with each other to pass data. It has been suggested that some networks are buying connectivity to Australia and the United States in order to peer locally within New Zealand.