Content
Content

Education
6.1. Institutional structure
Service delivery responsibilities
- The education sector includes primary and secondary education and tertiary education. It also includes early childhood education (ECE), which we discuss but, due to data limitations and the sector’s primarily private sector provision, have not included in our Forward Guidance for investment demand.
- The Ministry of Education (MoE) administers buildings and land for state schools and kura on behalf of the Crown. School boards are responsible for day-to-day maintenance and management of their property, with support from MoE regional offices. The New Zealand School Property Agency (NZSPA) is expected to be established in 2026 and have responsibility for planning, building, maintaining and administrating the school property portfolio, taking over from MoE. Network functions, including determining where growth needs to occur, will remain with MoE.
- State-integrated and private schools own or lease their land and buildings independently. A small number of schools are currently designated as charter schools. These are publicly funded and operated by a sponsoring organisation (rather than a traditional school board) and can be located on either Crown-owned or privately owned property. The Charter School Agency has oversight of these schools.
- Tertiary education institutions include universities, polytechnics, and wānanga, which are Crown entities, and some private training establishments. These entities own their property and are responsible for meeting their own investment requirements with occasional exceptions.
- Early childhood education services, including kindergartens, are mainly provided by community-based or privately owned entities, with the exception of early childhood services operated by councils and other publicly owned entities. They can operate on either a for-profit or not-for-profit basis.
Governance and oversight
- MoE oversees primary and secondary school education policy and legislation. With the creation of the NZSPA, MoE’s role in infrastructure provision will focus on operational planning, funding allocation and investment. This will include ongoing oversight of investment (including responding to projected changes in local enrolment demand) and the monitoring of investment. The NZSPA will take over major capital works, redevelopment projects and oversight of routine maintenance activities. MoE will continue to set performance frameworks for school boards, but this will no longer include the oversight of maintenance delivery.
- MoE also oversees policy and legislation for tertiary education. The Tertiary Education Commission has an oversight role over tertiary education providers.
- Early learning services must be licensed by MoE under the Education (Early Childhood Services) Regulations Act 2008. As it does with schools, MoE oversees the policy and legislation associated with ECE.
6.2. Paying for investment
- State schools are funded through general taxation with varying degrees of private/household co-funding.
- Once MoE allocates funding to schools, the associated School Board prepares a 10-year property plan of priorities, which is designed to operate under the funding allocation. This is used to ensure that buildings and facilities are adequate.
- School boards can also seek MoE consent to construct new assets using their own funds. Ongoing responsibilities for operating and maintaining those assets remain with the board.
- Tertiary institutions are funded through a mix of government funding, student fees and philanthropy. They may sell land with the consent of the Secretary for Education, or through the Crown asset transfer and disposal policy.
- A large share of the cost of ECE is passed through to customers. MoE offers subsidies for ECE which are issued directly to providers, the proceeds of which may be used for infrastructure.
6.3. Historical investment drivers
- At a high level, investment in new education infrastructure has historically been driven primarily by population growth, internal population migration and demographic change. Investment demand for primary and secondary schools is highly localised. Additionally, school premises and facilities often serve wider functions within their communities, such as civil defence, health and civic (election) hubs, along with providing community sport and education amenities.
- Student populations have pushed the number of schools to two main peaks. The first peak was around 1930, when the number of primary students drove school numbers to 3,256. Between the 1950s and 1970s, the number of primary and secondary school students approximately doubled. This led to more than 300 additional schools being built, but the number of smaller rural schools was rationalised, so the second peak occurred in the late-1960s at just over 3,000 schools. As student volumes declined in later decades, so did the number of total schools, although not in proportion to the decline in student volumes. This could reflect community values provided by schools and expectations that schools remain open despite dwindling enrolment numbers.
- As of July 2024, there were 2,468 state and state-integrated primary and secondary schools (excluding private schools, specialist, charter schools and teen parenting units).
- Significant growth in tertiary student numbers led to significant investment in tertiary education throughout the 1990s and 2000s.
- During periods of slower school rolls growth, investment is more focused on maintenance and renewal needs. Investment has also responded to unplanned renewal needs, such as weathertightness remediation for many school buildings built or modified between 1994 and 2005, and recovery after natural hazard events like the Canterbury earthquakes.
6.4. Community perceptions and expectations
This section summarises what we know about the New Zealand public’s perceptions and expectations of the education sector, at a national level.
- ‘Ageing schools and hospitals’ were the third most important infrastructure priority, according to a New Zealand Infrastructure Commission survey of over 23,000 New Zealanders.190
- Education services in general are very important to New Zealanders, consistently ranking in the top 10 issues.191
- Education services are the New Zealand public’s second highest priority for increased government spending, after healthcare services. However, it’s unclear whether this relates specifically to school infrastructure as opposed to the overall education system.192
- In a nationally representative survey undertaken by the Commission as part of consultation on the draft National Infrastructure Plan, 59% of New Zealanders who use schools reported that school infrastructure services meet or exceed their needs, while 41% reported it somewhat or consistently fails to meet their needs.
6.5. Current state of network
New Zealand’s difference from benchmark country average

Current state of network
Comparator countries: Australia, Chile, Finland, Iceland, Ireland, Norway, and the United States. Similarity based on income, population density, population share aged 5 to 17, population growth since 1960, exposure to natural hazard events, compulsory education ending age. Percentage differences from comparator country averages are based on a simple unweighted average of multiple measures for each outcome. Further information on these comparisons is available in a supporting technical report.193
- New Zealand’s spending on education infrastructure, as a share of GDP, is slightly higher than the average comparator country. On a per-student basis, we spend approximately the average.
- The average New Zealand primary and secondary school has 358 students, slightly above the OECD average and near the average for our comparator countries.
- The overall quality of school infrastructure does not appear to be affecting the quality of education in New Zealand relative to other countries. The share of school principals reporting a lack of, or poor quality, infrastructure affecting students’ education is low in New Zealand, in line with comparator countries. However, the findings of a recent Ministerial Inquiry into School Property included that many school buildings were undermaintained and there was a lack of transparency around investment decisions and prioritisation.
6.6. Forward Guidance for capital investment demand
Forecast investment levels for education (primary, secondary, tertiary)

This table provides further detail on our Forward Guidance, which is summarised in Chapter 3. Further information on this analysis and the underlying modelling assumptions is provided in a supporting technical report.194
- We expect overall education infrastructure investment to increase in dollar terms but decline as a share of GDP relative to recent years. The primary reason for this is population ageing, which means less demand for school infrastructure in relative terms.
- However, these averages mask important regional variations. For example, almost 20% of schools (369) have capacity utilisation over 105%, while 11% (224) have utilisation of less than 50%. Population distribution will influence expenditure requirements in certain areas, but it will also be important to balance equity of access.
- Demographic trends will present challenges for the sector about how to optimise renewals and maintenance to meet ongoing needs. Many schools built in the 1970s will require renewal, but some will need to be right-sized to meet demographic trends. At the same time, teaching spaces will need to be added to areas that are at capacity or growing.
- Future demand for schools will be increasingly driven by localised demographic changes. For example, Māori school-age populations are expected to grow significantly in most regions, while non-Māori school-age populations are expected to decline in most regions. This may increase the relative demand for schools with Māori immersion settings.
6.7. Current investment intentions
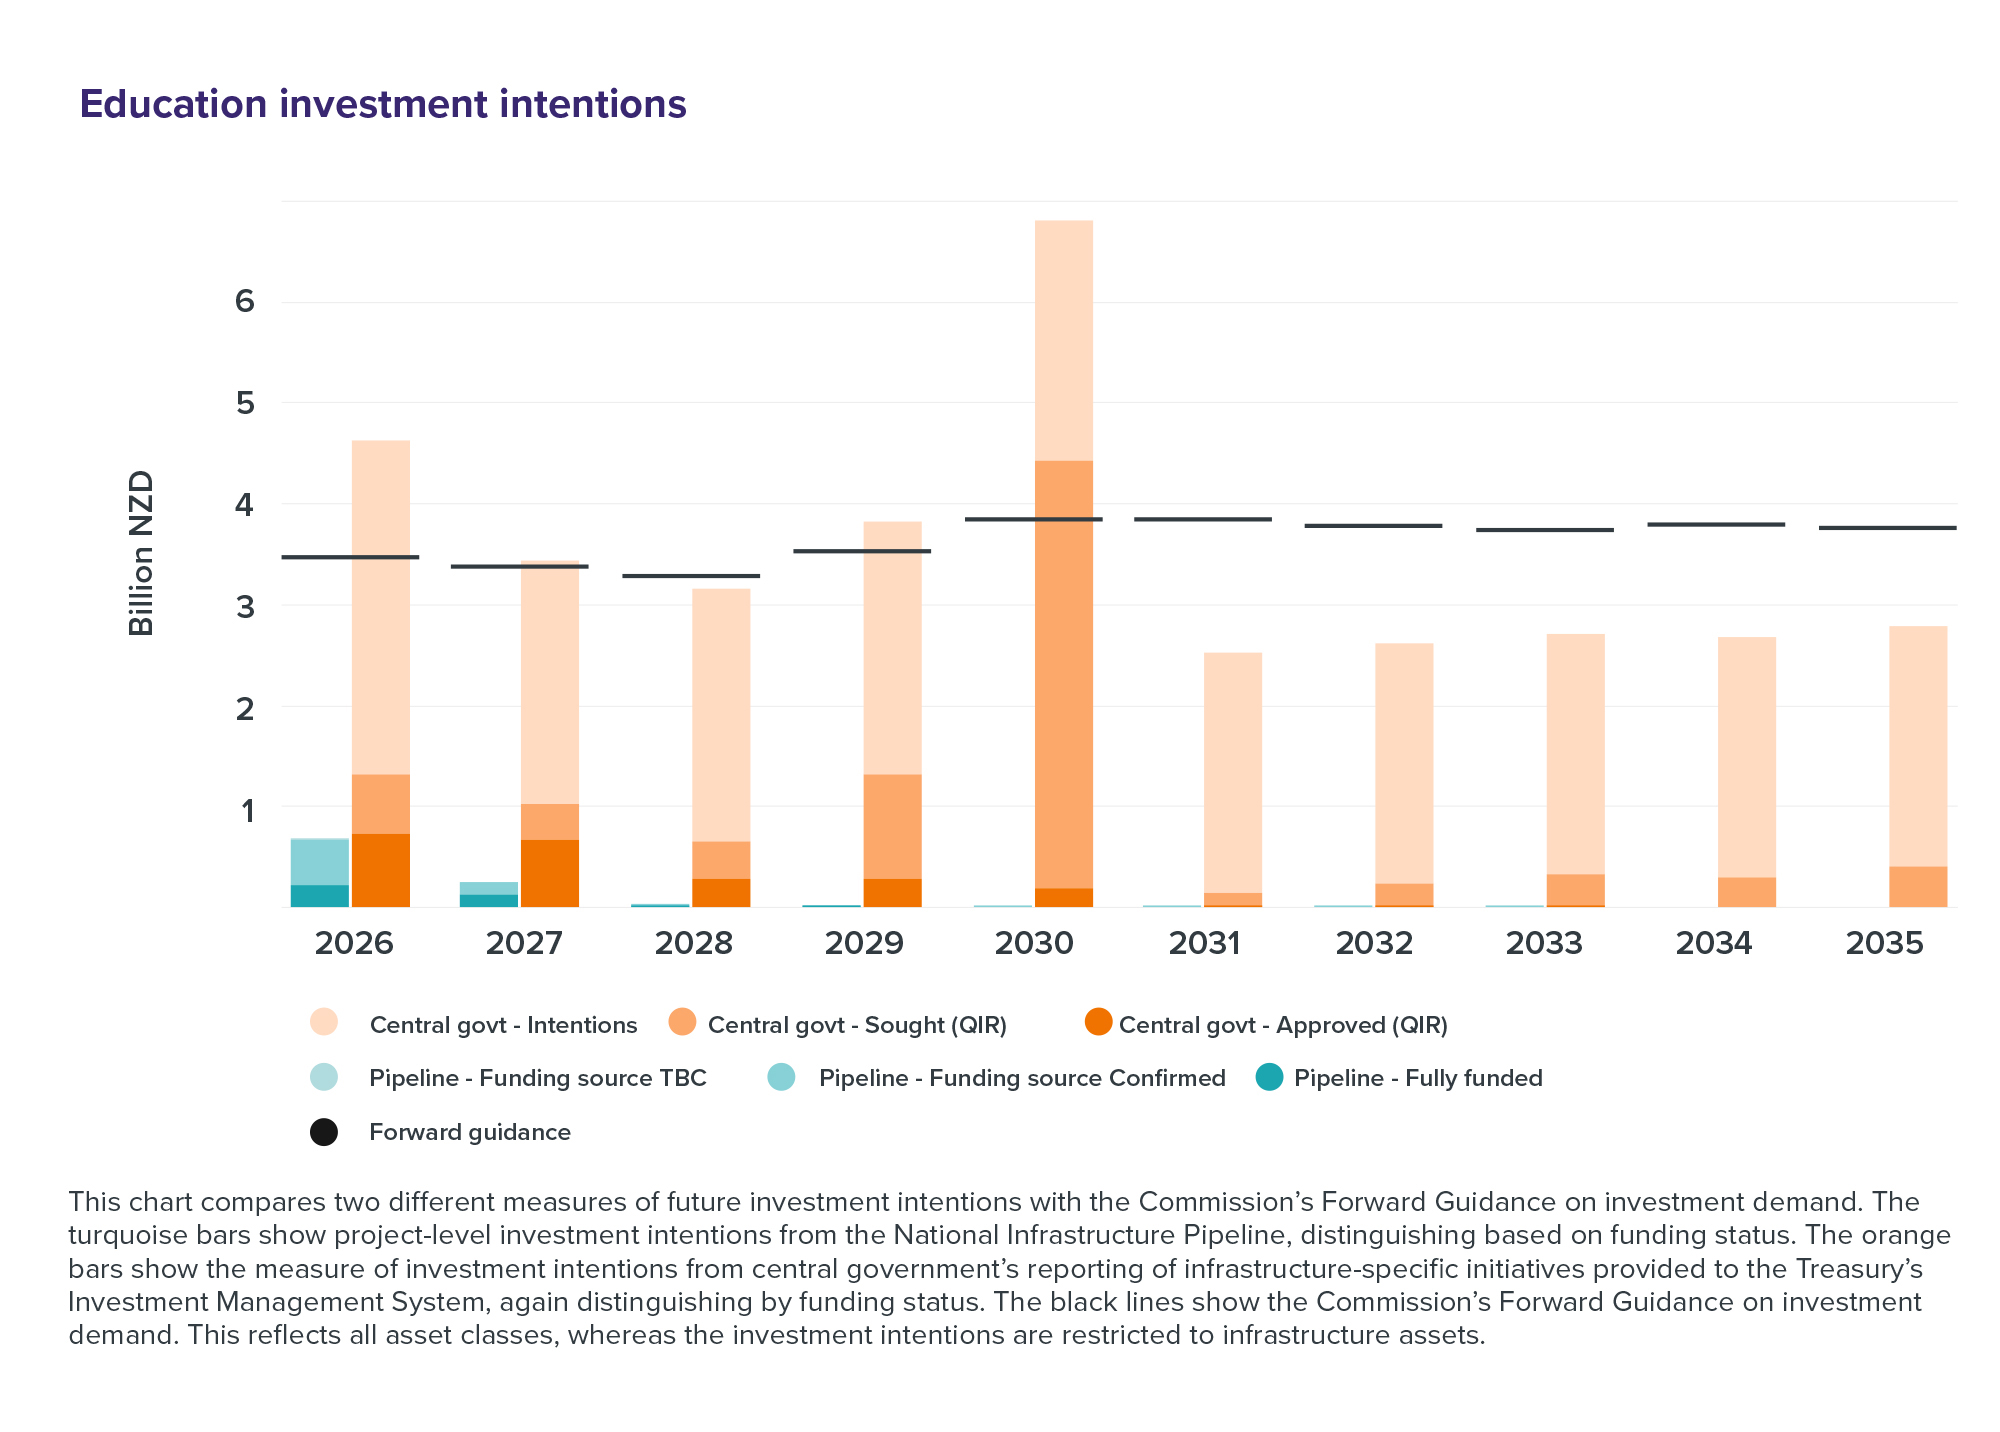
- Education infrastructure investment has risen in recent years, but the ongoing outlook is less clear.
- The following chart shows that projected spending to deliver initiatives in planning and delivery in the Pipeline (turquoise bars) and programme-level intentions in central government’s reporting to the Treasury’s Investment Management System (orange bars) are in line with the Commission’s Forward Guidance outlook (black lines) in the late 2020s but decline after that point.
- The Ministry of Education undertakes longer-term network planning. However, education seems to have short-term funding horizons, especially for specific projects. This reflects the fact that projects are often small in scale, requiring shorter lead times to implement. Over the next decade, specific initiatives in the Pipeline are only equal to 3% of the Commission’s Forward Guidance on future investment demand.
Figure 51: Education investment intentions

This chart compares two different measures of future investment intentions with the Commission’s Forward Guidance on investment demand. The turquoise bars show project-level investment intentions from the National Infrastructure Pipeline, distinguishing based on funding status. The orange bars show a measure of investment intentions from central government’s reporting of infrastructure-specific initiatives provided to the Treasury’s Investment Management System, again distinguishing by funding status. The black lines show the Commission’s Forward Guidance on investment demand. This reflects all asset classes, whereas the investment intentions are restricted to infrastructure assets.
6.8. Key issues and opportunities
- Asset management and investment planning: A key challenge for the sector is to manage uneven and changing geographic demand for education infrastructure alongside maintaining and renewing existing assets. Making the most efficient use of existing assets will enable funds to be freed up to address concentrated areas of demand, which may also include the recycling or repurposing of existing assets no longer aligned with demand.
- Uneven demographic change: While the overall number of students is expected to decline over time, there will still be areas with very high demand. The Commission and MoE’s modelling shows that areas around Auckland and parts of Canterbury are expected to have growing school demand. Moreover, areas with high Māori populations are likely to see higher demand for new school infrastructure. While the number of non-Māori student-aged children is expected to decline over the next 20 years, numbers of Māori students are expected to grow by almost 40%. This could provide opportunities to ensure future infrastructure investments in schools and kura with Māori immersion programmes are well-aligned to changing demands.