Content
Content

3.1 Aligning investment with long-term needs
Te tīaroaro i te haumitanga ki ngā matea tauroa
Context
New Zealand already has a lot of infrastructure. There have been many boom-and-bust cycles, but over the past 150 years we’ve almost always invested between 5% and 7% of GDP annually to build the assets that underpin our way of life.
New Zealanders benefit from these investments every day. A large proportion of our electricity generation is renewable thanks to hydroelectric power stations. The roads built by our ancestors allow us to travel and move goods to some of the most remote parts of the country. Our towns and cities have a built legacy of water networks, schools, hospitals and much more.
International benchmarking suggests the infrastructure we have measures up well. The Commission compared how much New Zealand has invested in different infrastructure sectors relative to other countries with challenging terrain and small, dispersed populations. We also looked at how the quality and quantity of our assets compares, and how well they get used.
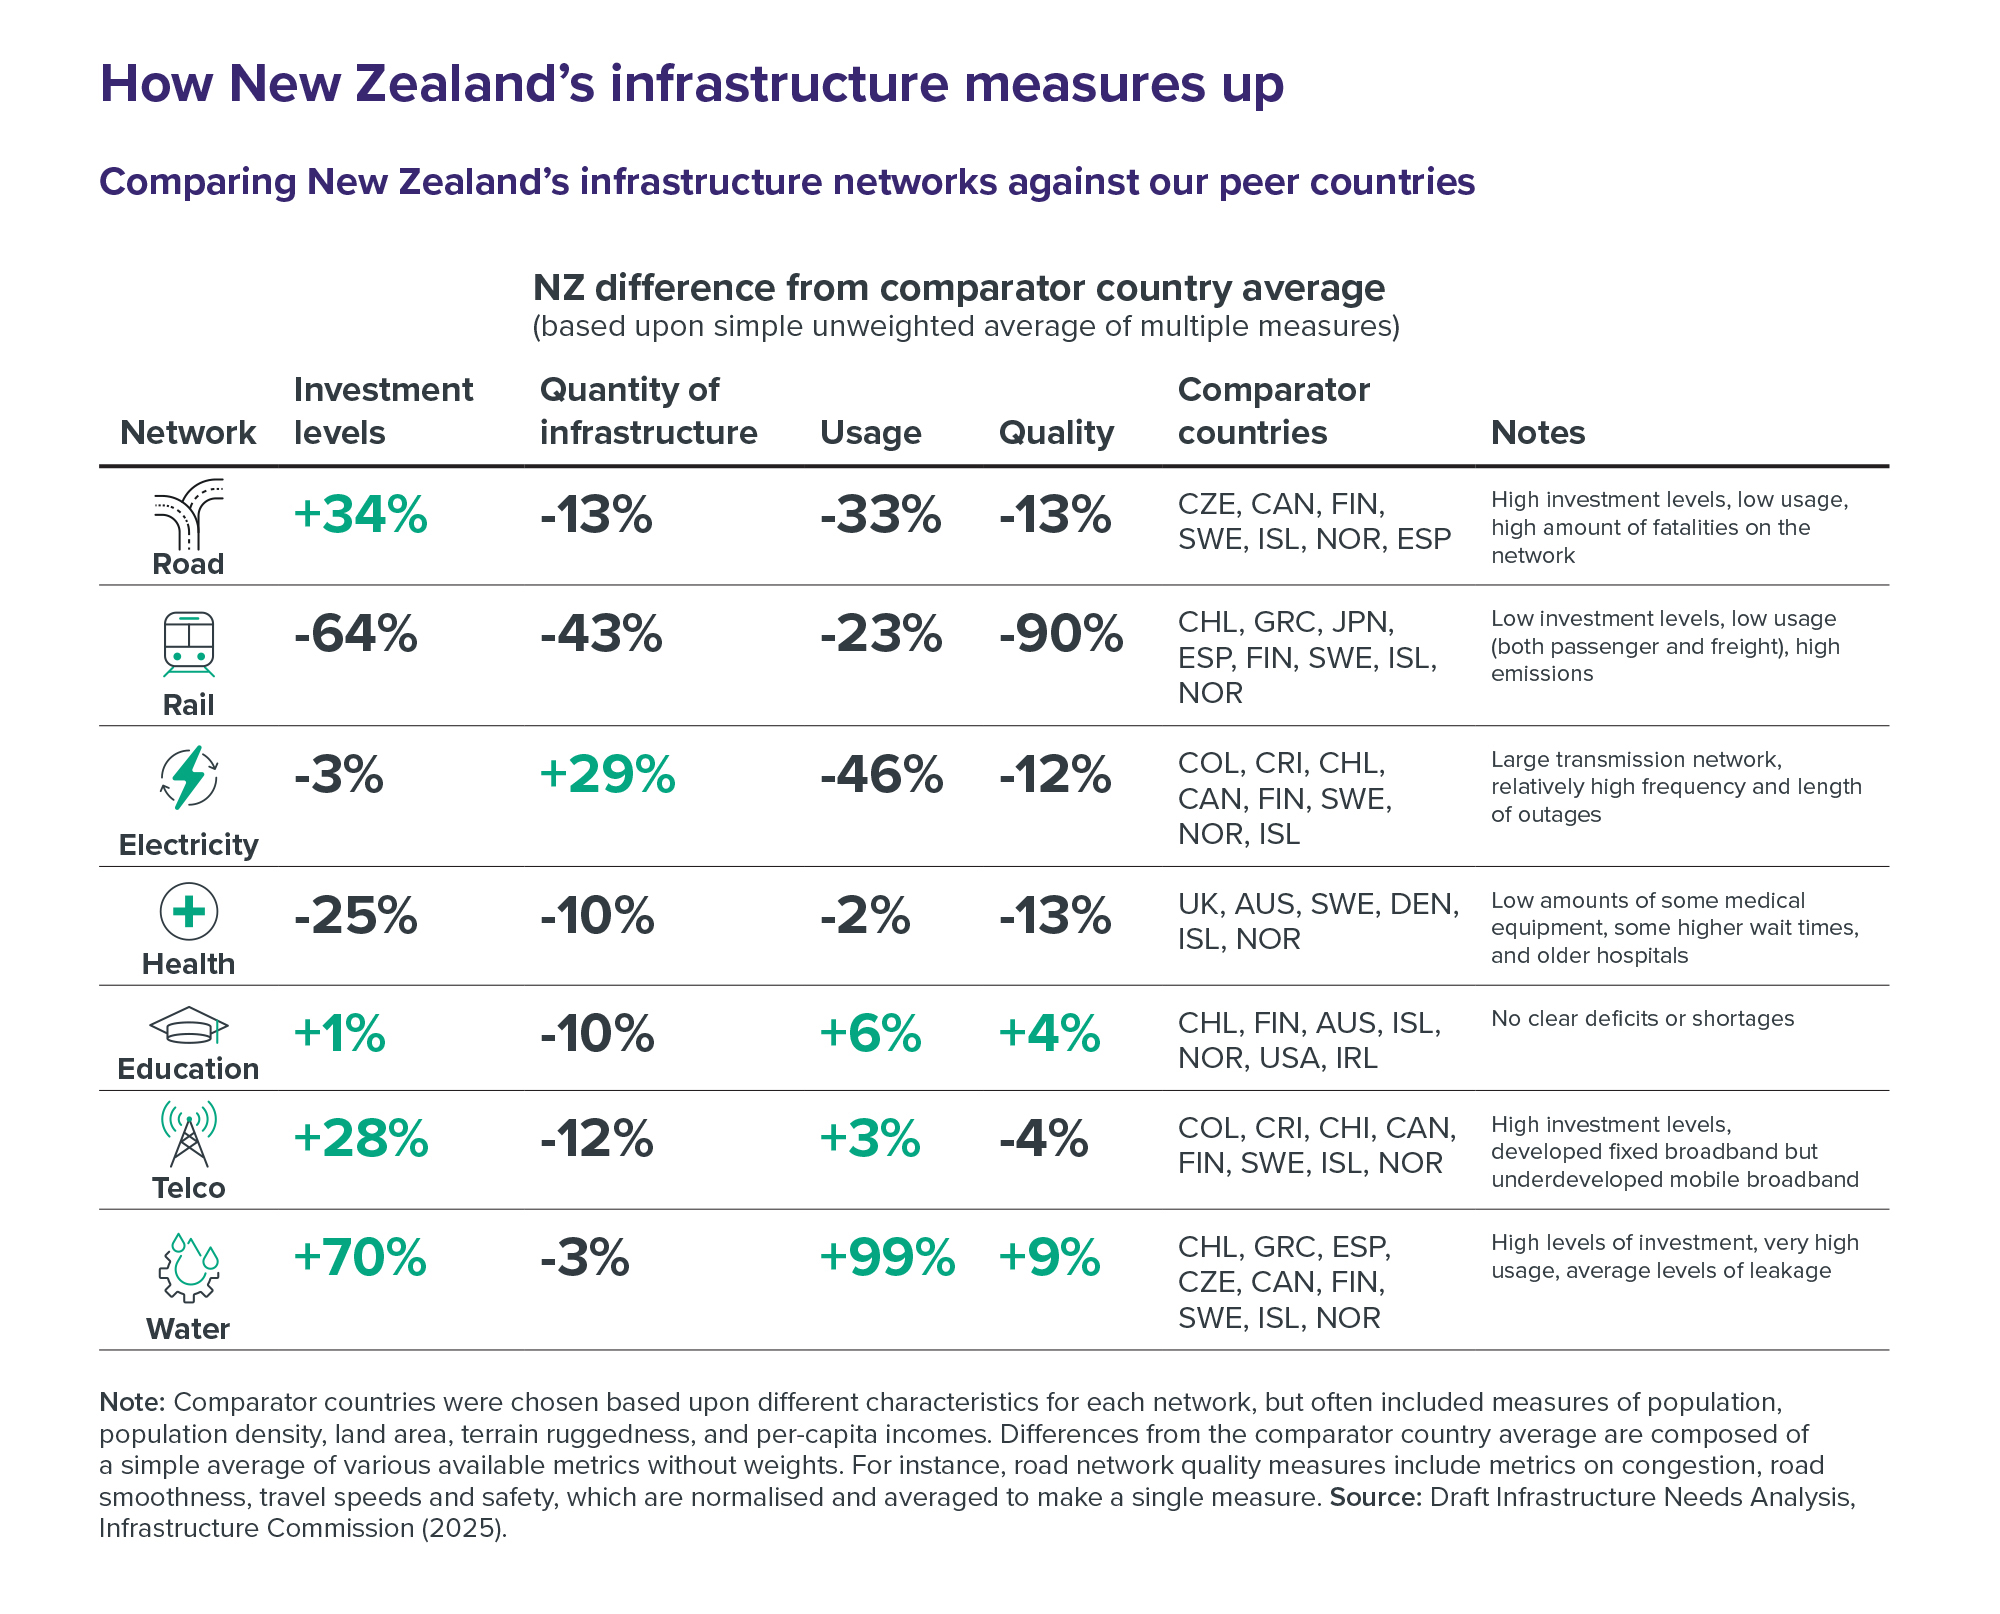
New Zealand may have an investment efficiency issue, but we see no signs of across-the-board deficits in the physical amount of infrastructure we have. New Zealand has roughly as much electricity generation, water and wastewater pipes and roads per person as our peer countries (Figure 11).21, 22 In some cases, like fixed-line broadband networks and school infrastructure, we have more or better-maintained infrastructure. Conversely, more people die on our roads, our households are among the highest users of water in the OECD, and we may have gaps in mobile broadband and railway track maintenance relative to our peers.
How New Zealand’s infrastructure measures up
Figure 11: Comparing New Zealand’s infrastructure networks against our peer countries

Notes: Comparator countries were chosen based upon different characteristics for each network, but often included measures of population, population density, land area, terrain ruggedness, and per-capita incomes. Differences from the comparator country average are composed of a simple average of various available metrics without weights. For instance, road network quality measures include metrics on congestion, road smoothness, travel speeds and safety, which are normalised and averaged to make a single measure. Source: Draft Infrastructure Needs Analysis, Infrastructure Commission (2025).
The challenge is to keep our existing infrastructure going while also investing in new assets to meet demand. According to our analysis of International Monetary Fund figures, New Zealand invested more on public infrastructure as a proportion of GDP than any other OECD country between 2010 and 2019.23 Future fiscal constraints and megatrends like an ageing population and slowing productivity growth will mean maintaining this infrastructure, and building more infrastructure, could strain affordability if we don’t plan well.
The Commission’s Forward Guidance sets out what an affordable level and mix of infrastructure investment could look like over the next 30 years. It provides an independent view of a sustainable investment path – much as central bank forecasts guide expectations about future interest rates. This makes it most useful for helping to prioritise funding between sectors over the medium to long term. Our Guidance should inform fiscal strategy, asset management and investment planning, spatial planning, and workforce development policy. Rather than predicting exact spending, it offers a strategic benchmark to show what is affordable, when pressures may emerge, and how different choices shape the investment outlook.

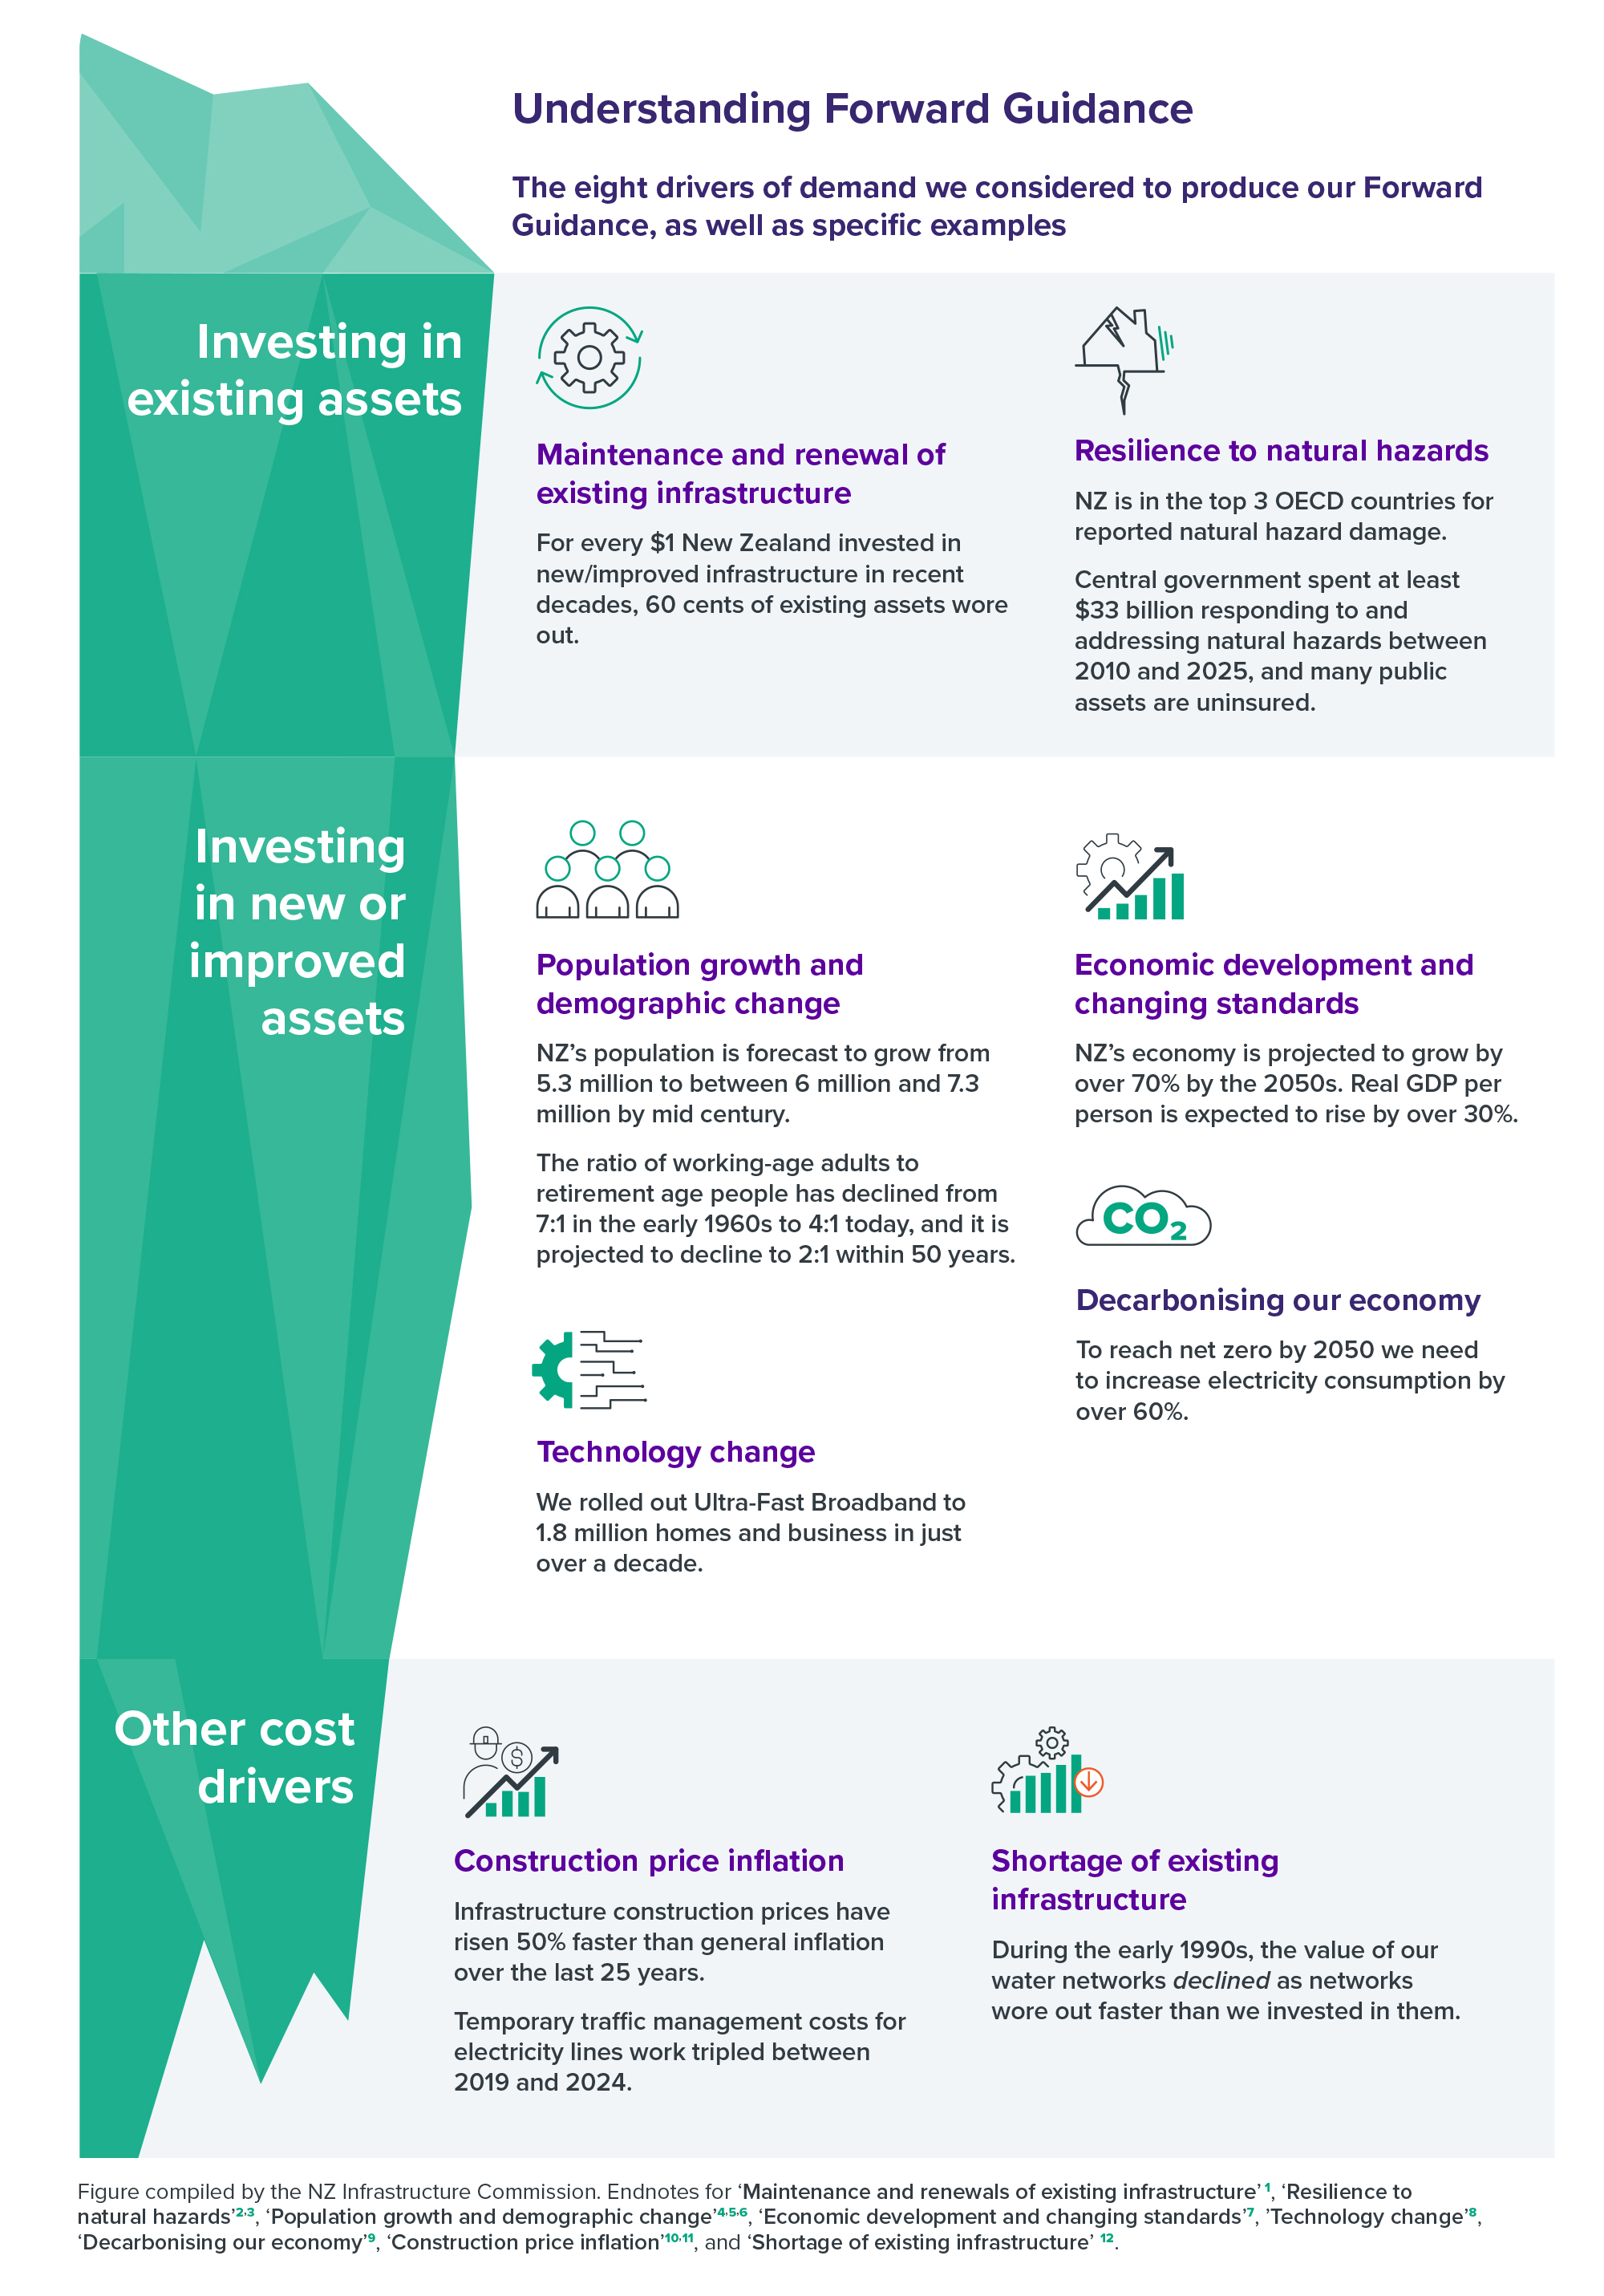
We produced our Forward Guidance based on several drivers of demand for infrastructure. The projections are based on how we’ve invested in the past, how fast existing infrastructure assets are wearing out, how rapidly network demand might grow given national-level population and economic projections, what costs we can expect to incur from natural hazard events, and how fast construction prices may rise based on historical trends (Figure 12).
Our Forward Guidance is achievable. It illustrates what an affordable level of future investment looks like across different sectors, allowing decision-makers to use it as a benchmark against which to assess current agency plans. This helps keep value for money front of mind, ensuring investment is directed toward the most impactful and cost-effective projects rather than exhaustively planning initiatives we may never be able to afford. We consider the approach outlined in our Forward Guidance to be affordable, as the forecast investment levels align with what New Zealanders have historically been willing to spend on infrastructure.
Understanding Forward Guidance
Figure 12: The eight drivers of demand we considered to produce our Forward Guidance, as well as specific examples

Figure compiled by the NZ Infrastructure Commission. Endnotes for ‘Maintenance and renewals of existing infrastructure’24, ‘Resilience to natural hazards’25, 26, ‘Population growth and demographic change’27, 28, 29, ‘Economic development and changing standards’30, ’Technology change’31, ‘Decarbonising our economy’32, ‘Construction price inflation’33, 34, and ‘Shortage of existing infrastructure’35.
Strategic direction
Infrastructure spending grows within a clear and affordable long-term fiscal strategy
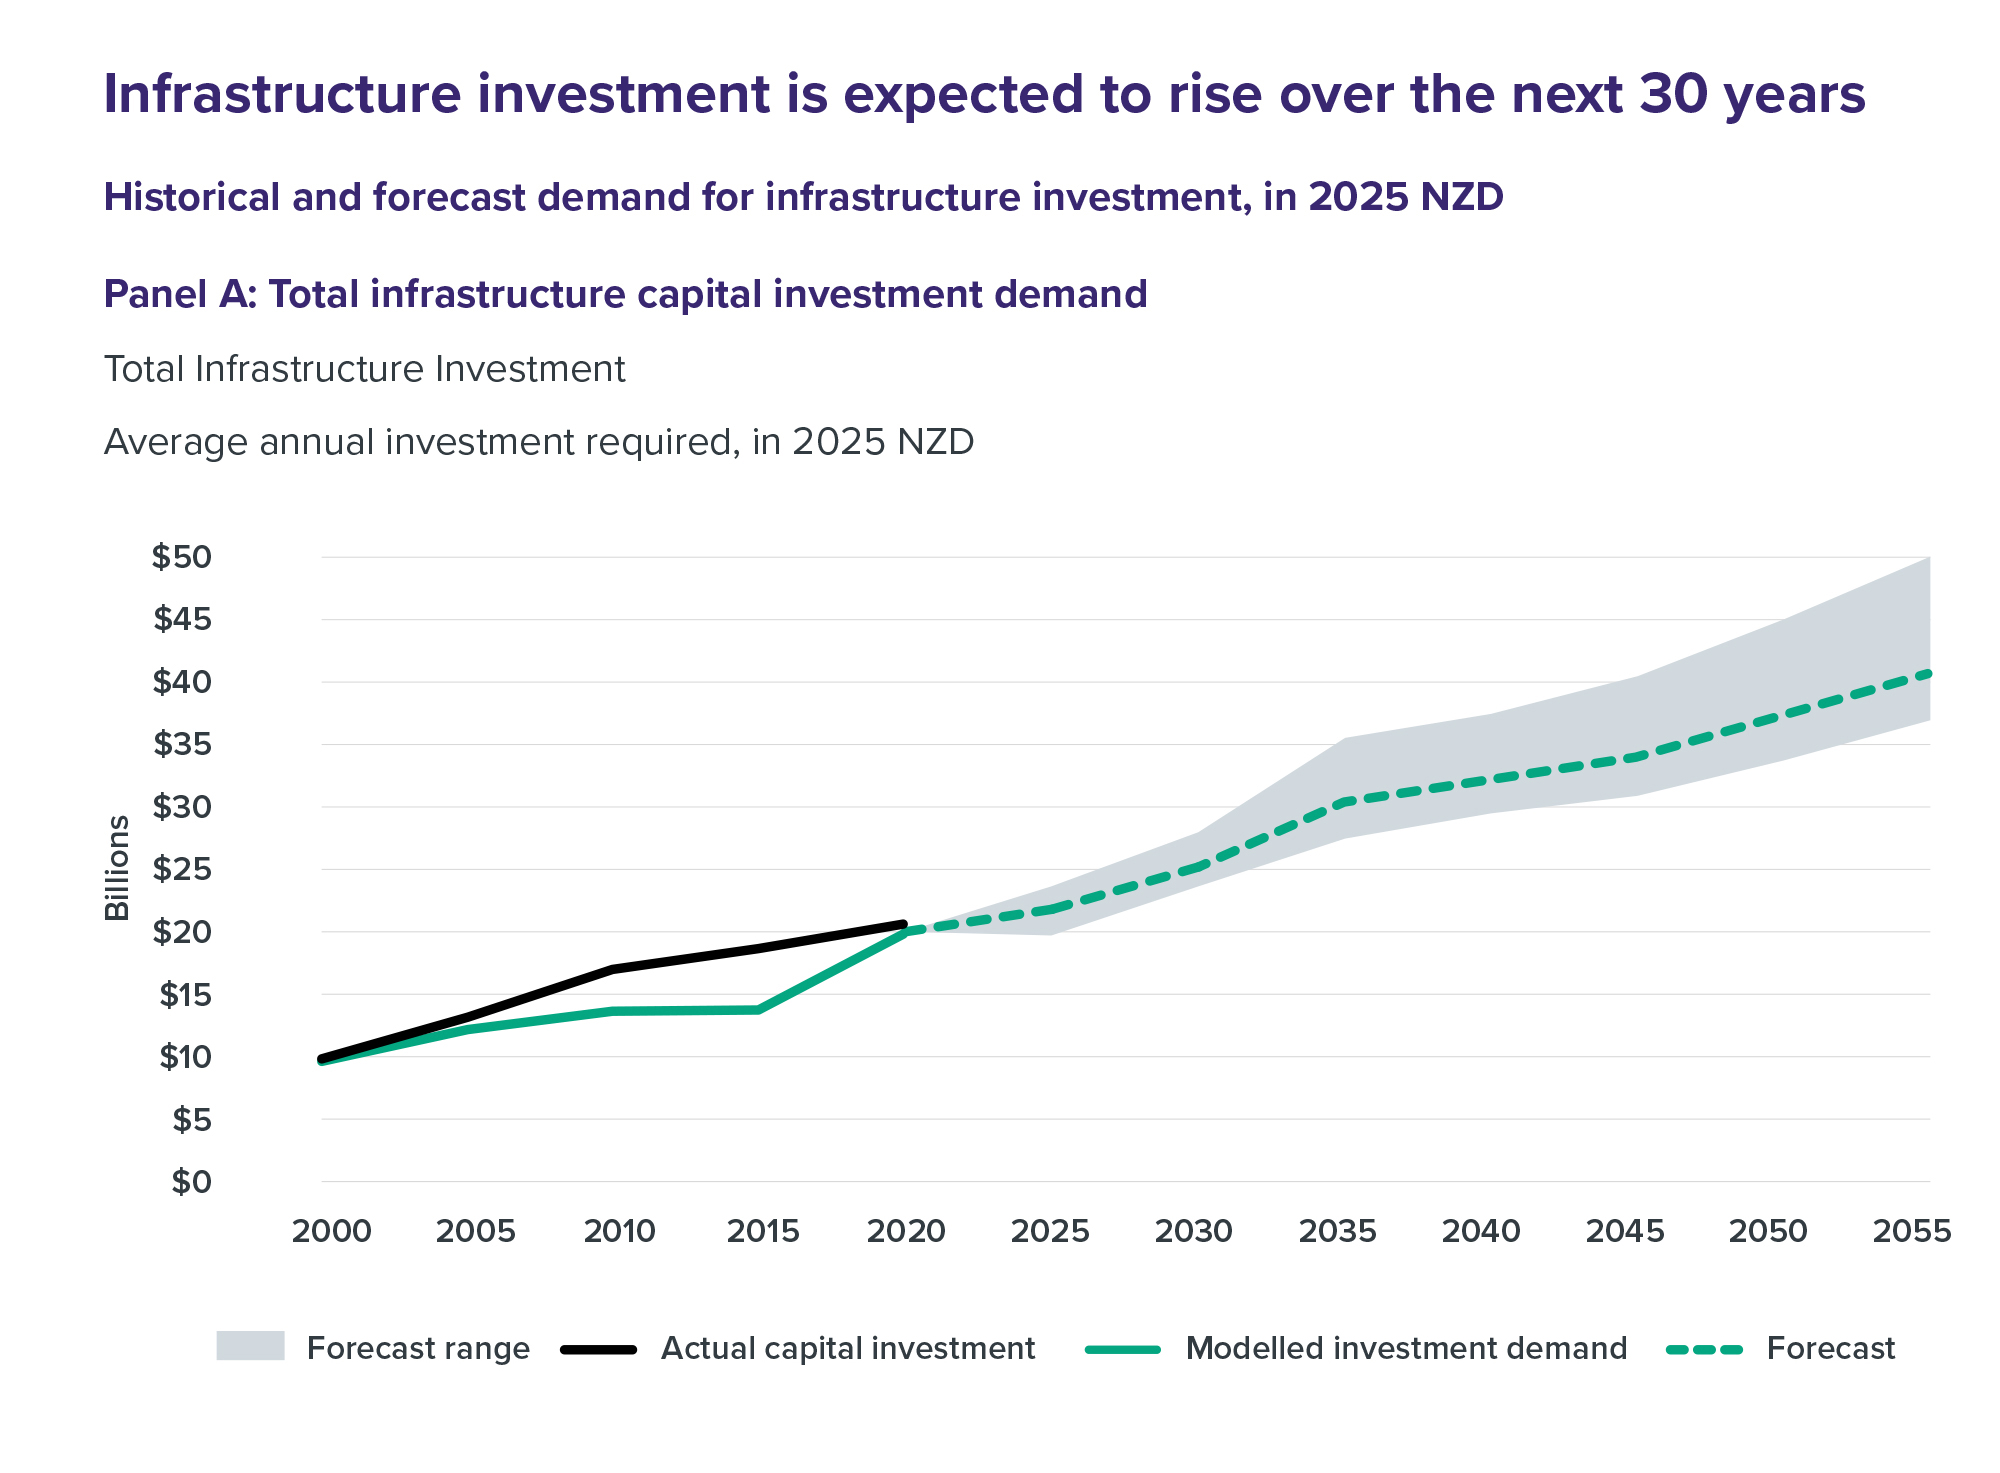
Demand for infrastructure investment will increase over the next three decades (Figure 13). To meet demand, annual capital investment will need to increase from just over $20 billion today to more than $40 billion by the 2050s (in 2025 NZD terms). This includes all types of infrastructure investment, regardless of ownership arrangements. We provide a sectoral breakdown below (Table 2).
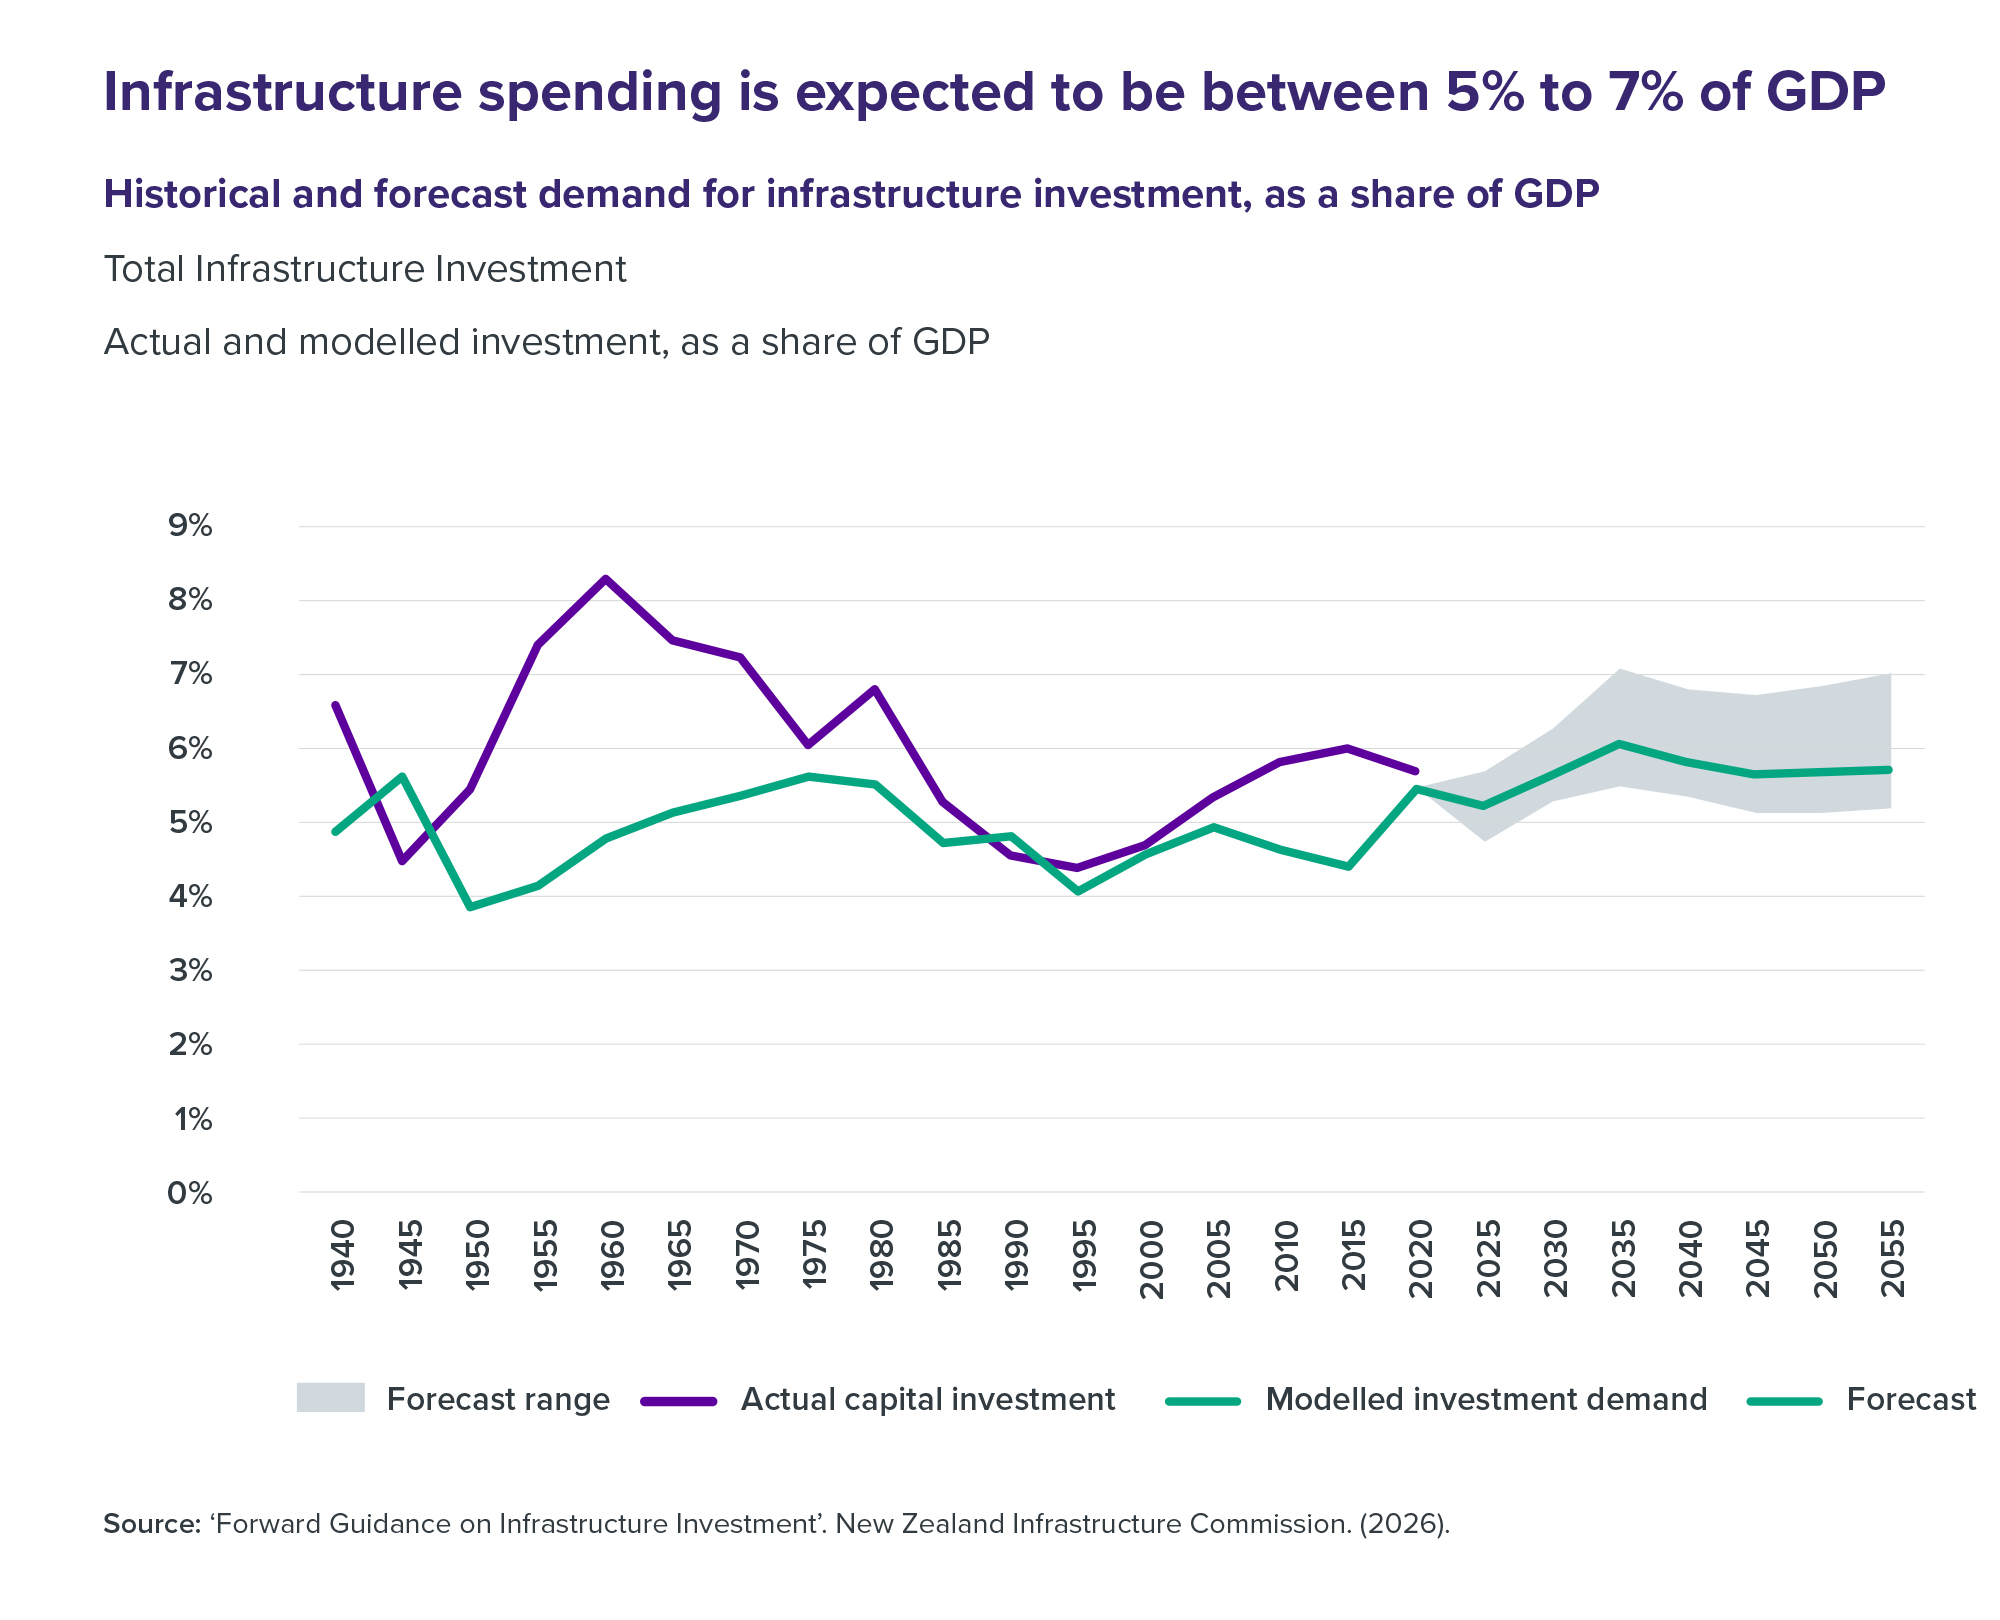
While the total spend on infrastructure will increase, the ‘share of our wallet’ spent on investment is expected to remain stable. Our analysis indicates infrastructure investment will need to average around 6% of GDP annually over the next 30 years. Spending could be slightly higher or lower, depending on what scenario happens. The Commission expects this to reasonably occur within the range of 5% to 7% of GDP (Figure 14).36 This is within the bounds of what New Zealand has been willing to invest in the past, so we consider our Forward Guidance to be realistic and sustainable.
The balance of investment will need to shift. Rising investment demand reflects the need to renew and replace existing infrastructure, as well as building new or improved infrastructure in response to population growth and demographic changes, economic growth and decarbonisation needs. Spending will also be driven by the need to make existing infrastructure more resilient to natural hazard events. It is already the single biggest driver of investment, but we expect spending on renewals to become relatively more important as existing infrastructure wears out and demand drivers for new infrastructure, such as population growth, slow overall across the country.
Infrastructure investment is expected to rise over the next 30 years
Figure 13: Historical and forecast demand for infrastructure investment, in 2025 NZD
Panel A: Total infrastructure capital investment demand
Total Infrastructure Investment
Average annual investment required, in 2025 NZD

Note: Figure includes capital investment but exclude operational spending on maintenance. Source: ‘Forward Guidance on Infrastructure Investment’. New Zealand Infrastructure Commission. (2026).
Panel B: Composition of capital investment demand
Total Investment Forecast
Modelled average annual investment required, 2025–2055

Note: Figure includes capital investment but exclude operational spending on maintenance. Source: ‘Forward Guidance on Infrastructure Investment’. New Zealand Infrastructure Commission. (2026).
Infrastructure spending is expected to be between 5% to 7% of GDP
Figure 14: Historical and forecast demand for infrastructure investment, as a share of GDP
Total Infrastructure Investment
Actual and modelled investment, as a share of GDP

Source: ‘Forward Guidance on Infrastructure Investment’. New Zealand Infrastructure Commission. (2026).
Spending could be higher if New Zealand’s population and economy grow more rapidly. Spending could also be higher if we find investment opportunities that significantly increase the size of the economy or generate large increases in revenues that could fund more investment (Box 1). Significant technological advances have created these opportunities in the past, as well as demand for entirely new classes of infrastructure. Examples include the roll out of Ultra-Fast Broadband or the electrification of New Zealand in the 1920s.
The Government, advised by the Treasury, should use our Forward Guidance to inform how it sets capital allowances for new infrastructure spending. This process, which happens through the annual Budget cycle, is one of the key levers for Governments to achieve their fiscal strategy – a plan for managing public finances, including debt levels. Our Forward Guidance provides a benchmark the Government can use to inform its intended capital spending levels and to prioritise infrastructure spending between sectors, subject to top-down constraints like the need to pay down debt. The Commission will provide updated versions of our projections to the Treasury, as the chief financial advisor to the Government.
![]()
Box 1
How infrastructure can boost economic growth
Infrastructure investment is important for sustaining and expanding economic activity. Networks of pipes, roads, ports and other assets move raw materials to factories and finished goods to markets, forming the backbone of production. Beyond supporting industry, infrastructure enables housing growth, supports job creation, and enhances wellbeing by keeping people connected, mobile, and entertained. Most importantly, high-quality infrastructure can underpin future economic growth by improving productivity – where we get better at making and doing things with the resources we have.
Infrastructure can lead to productivity growth in several ways. It:
- Helps our cities grow and expand. Bigger, denser cities are more productive because they bring people and businesses closer together. Density allows for more efficient use of infrastructure, for businesses to specialise, and for new ideas and innovations to spread more easily.
- Speeds up the adoption of new technologies. Many new technologies can only be adopted when the enabling infrastructure is in place. For example, access to Ultra-Fast Broadband has allowed businesses and people to adopt new ways of working that depend on faster internet access.
- Helps high productivity industries and firms grow. Overall productivity can be increased by shifting resources to higher productivity industries and firms. As a small island nation, we need to enable our industries and firms to compete for market share internationally.
Where and when should we make these investments?
Investing in infrastructure can support productivity and economic growth, but it isn’t a panacea. Other investments – including education, research and development, and business investment – can be just as, if not more, impactful. This makes it important to recognise the trade-offs involved when using infrastructure for economic growth and properly assess projects to ensure their impact.
New infrastructure investment can lift productivity growth when it alleviates a bottleneck where demand exceeds supply. Infrastructure can equally act as a drag on growth if the benefits we get from it are outweighed by high debt, maintenance and other costs, or if public investment crowds out private investment.37 This makes it essential to choose high-quality projects.
Bottlenecks are most likely to occur under two conditions: significant technological innovation that drives demand for entirely new infrastructure networks or when demographic shifts – such as rapid population growth and urbanisation – happen faster than our existing infrastructure can keep up. When this happens, new and improved assets can unlock latent demand and enable new activity.38
This occurred when New Zealand electrified in the 1920s. Electricity was a growing technological innovation, and the benefits were large and clear. It meant shifting from candles, coal stoves and iceboxes to electric lights and refrigerators. People were more than willing to pay for those transformational benefits.
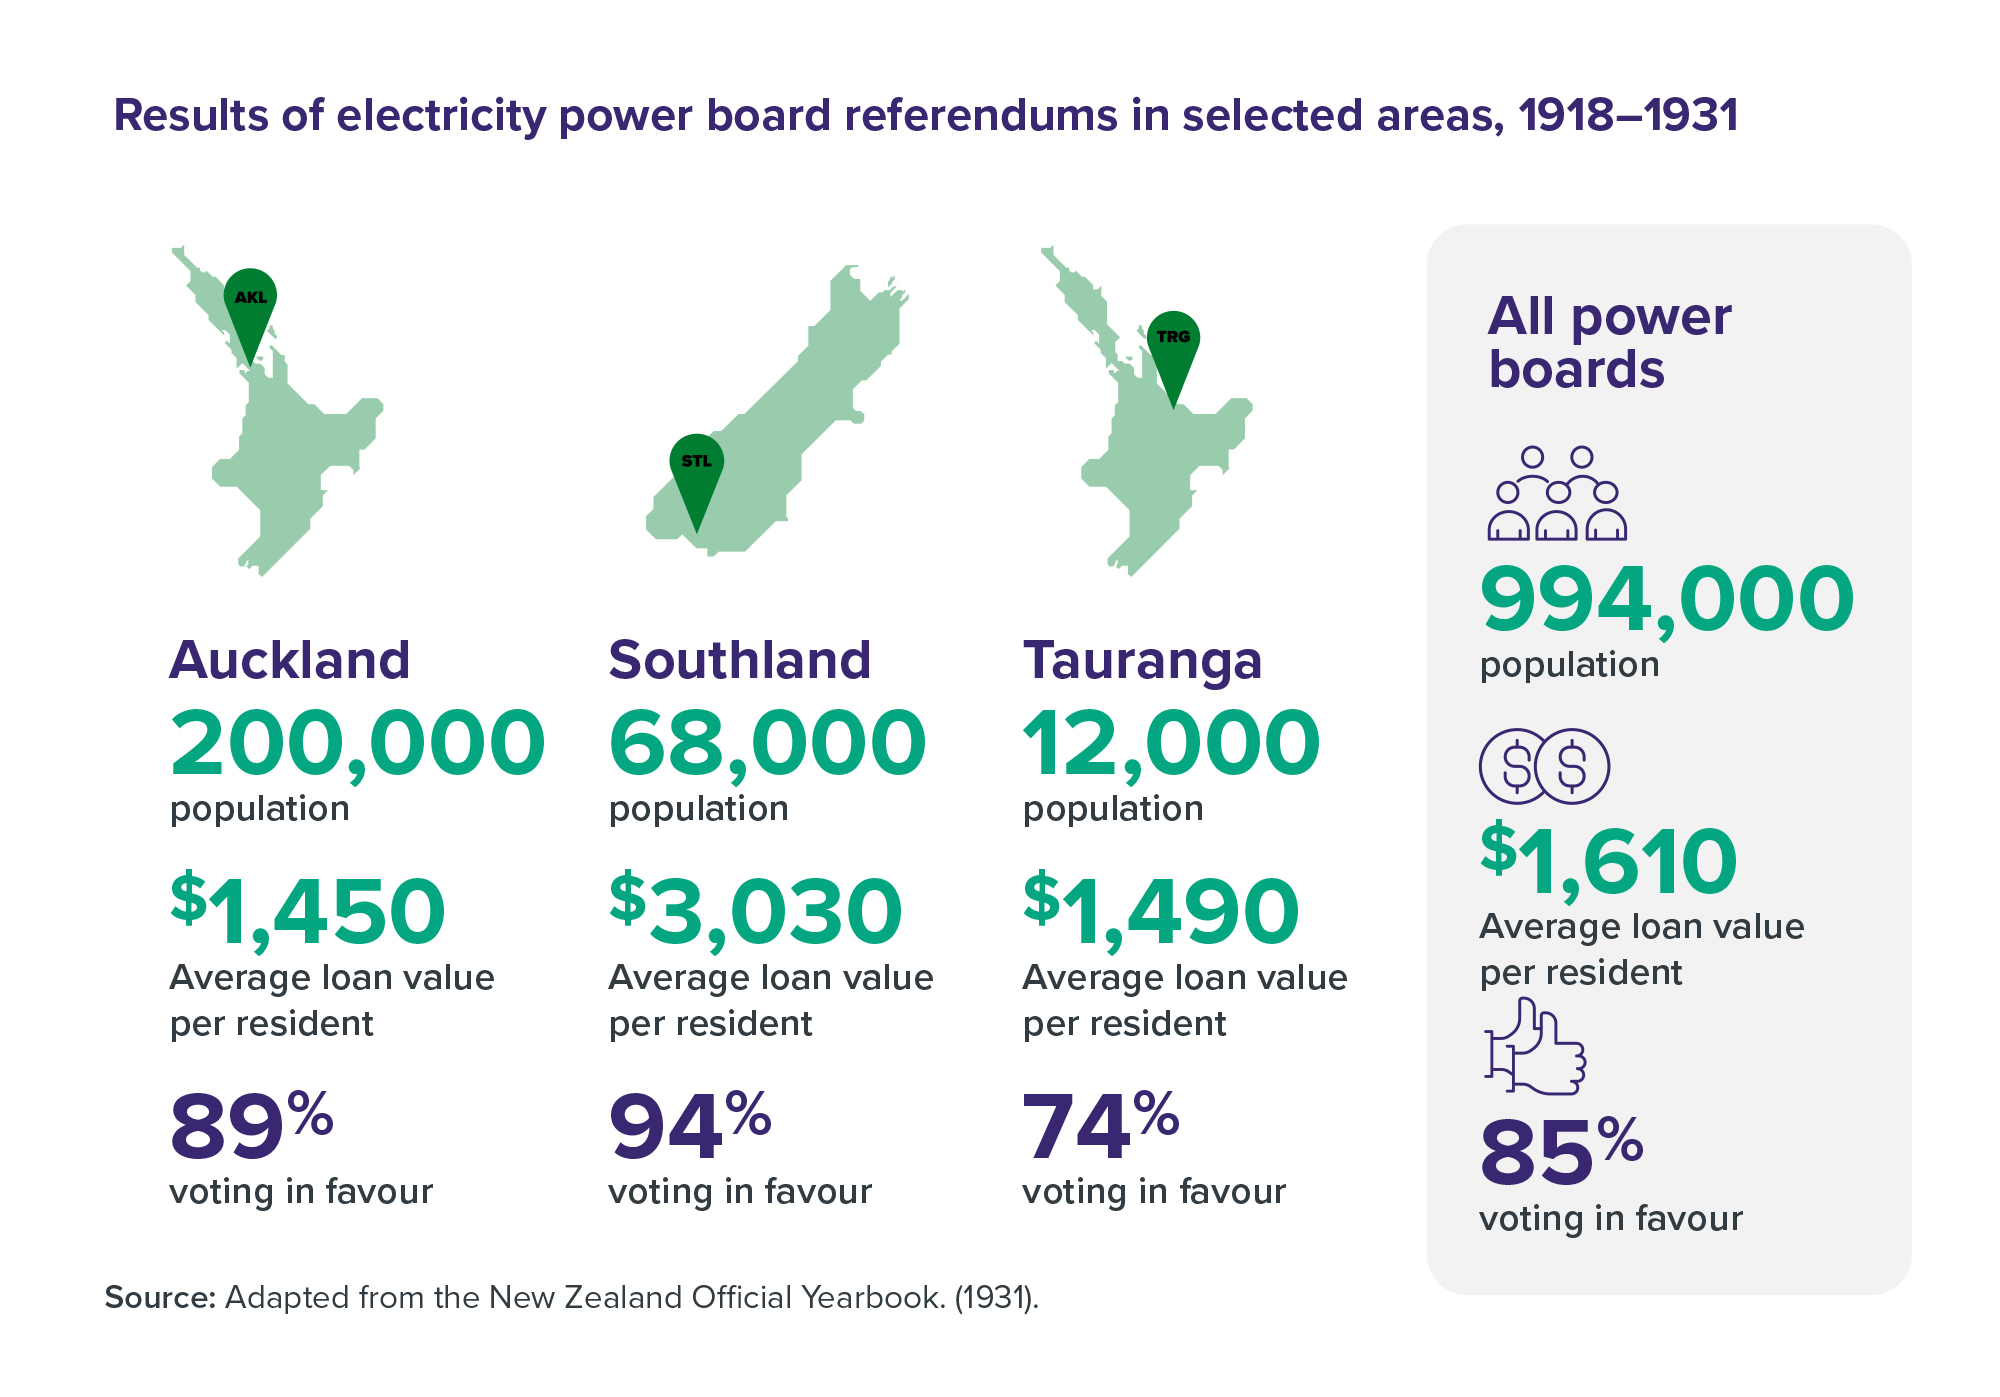
To finance the development of these distribution networks, local power boards issued £12.8 million in loans that were then paid back by electricity users. This is equal to NZD$1.7 billion in 2024 dollars, or around $1,600 per resident.
Each of these loans needed to receive voter approval through a referendum. Although the cost of electrification was high for the average household, all power board referendums passed, with an average of over 85% support (Figure 15). This would be the equivalent of current Auckland residents voting overwhelmingly for a $2.9 billion piece of infrastructure, paid for solely by residents.
Figure 15: Results of electricity power board referendums in selected areas, 1918–1931

Source: Adapted from the New Zealand Official Yearbook. (1931).
Where are the bottlenecks today?
New Zealand has existing, mature infrastructure networks. Consistent with our Forward Guidance, network growth should generally be balanced with demand growth and the priority should be on cost-effectively maintaining and renewing existing assets. This will support economic growth by ensuring that infrastructure is available where and when it’s needed, without burdening firms and workers with excess costs. Sometimes, specific investments into areas such as ports, electricity supply, or urban water and transport infrastructure are needed to support growing sectors of the economy.
Governments also have options for more precise interventions. They can:
- Keep an eye out for the next dominant telecommunications technology. Telecommunications is an area of persistent technological change, with new infrastructure networks making past networks redundant. The key focus in telecommunications will be monitoring what the next dominant network is likely to be and removing barriers to its rapid adoption.
- Consider small investments to unlock growth in high-productivity industries. For example, rapid advancements in rocket technology mean that remote parts of New Zealand's East Coast can now support an emerging space and advanced aviation industry. Infrastructure investments in Mahia and Kaitorete alleviated access bottlenecks and allowed the industry to grow. Importantly, these investments followed the needs and locations of the industry. Speculatively building a rural road is unlikely to result in the development of a spaceport. But if a world leading rocket company is wanting to invest, the returns on infrastructure investment can be large.
Infrastructure investment is often discussed as a way of boosting the economy during a downturn. However, international research and domestic experience show major projects are seldom timely economic stimulus, often providing stimulus after the downturn has passed and increasing inflationary pressures.39 Stable, predictable investment in maintenance and renewal can provide baseline activity that supports the industry and economy during a downturn.
The investment mix evolves to reflect shifting national needs
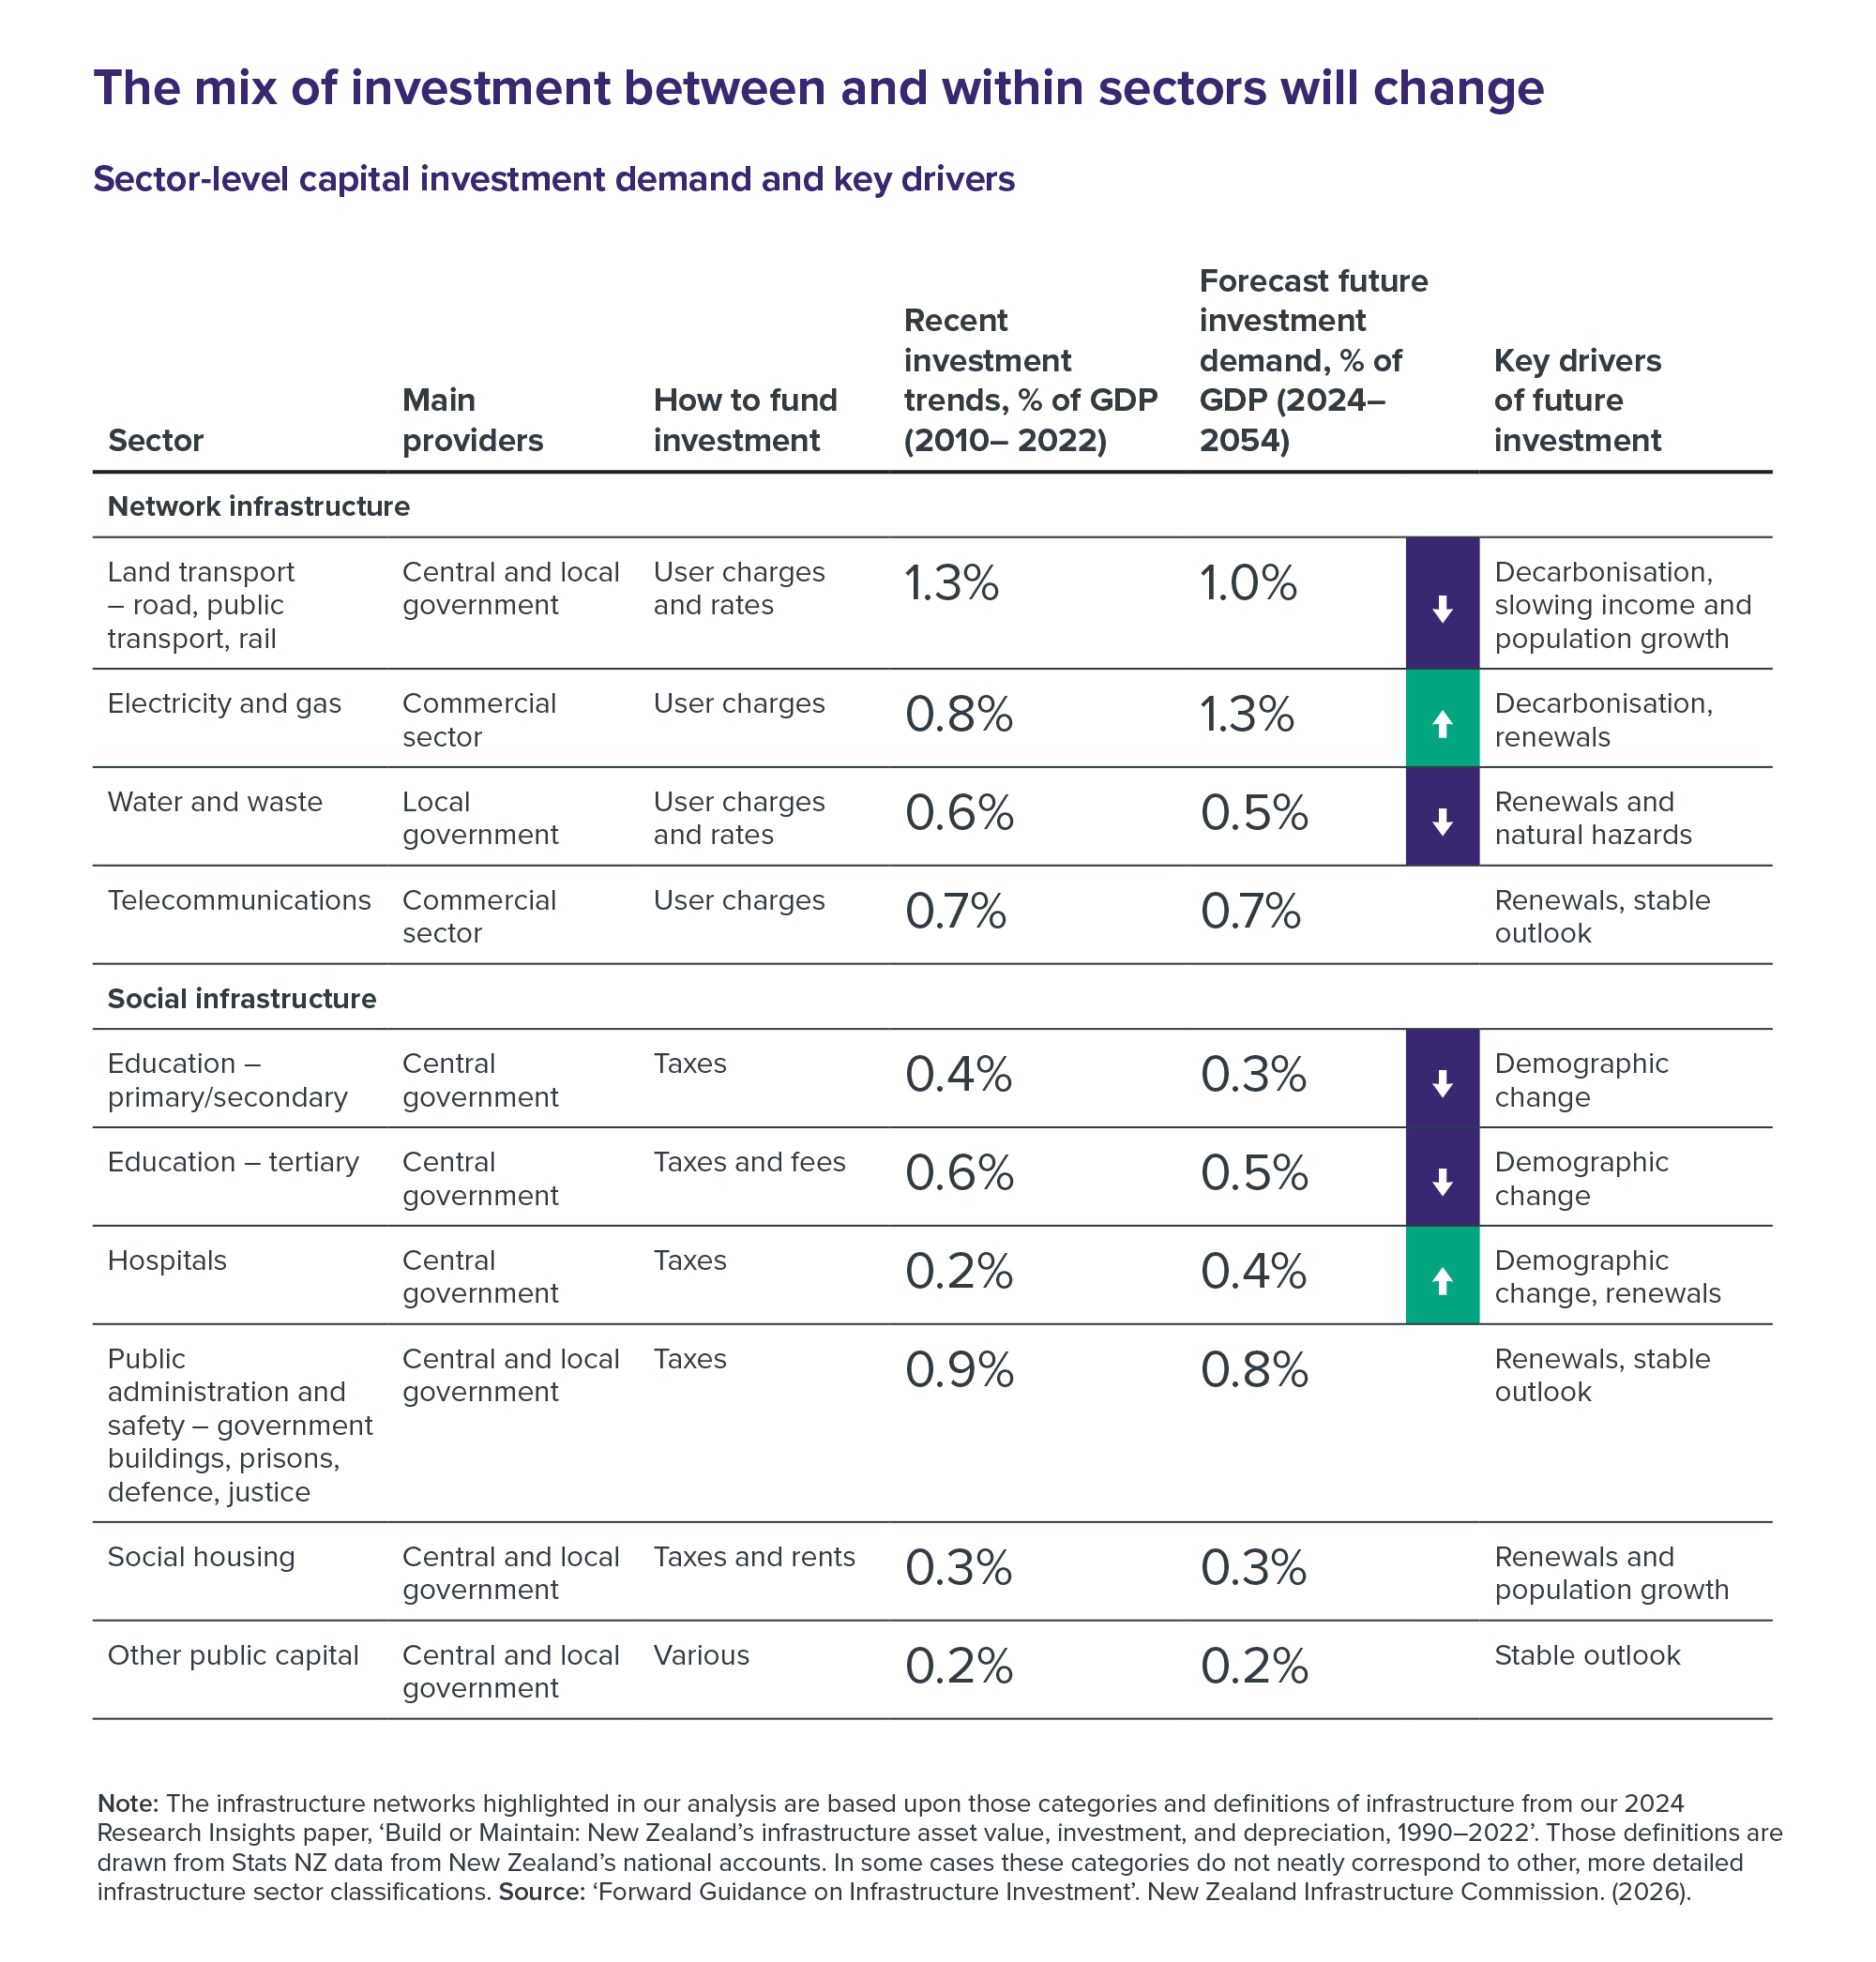
The mix of investment will change in the future. Long-term trends and policy goals will boost demand for some types of infrastructure and reduce it for others (Table 2). For example, an ageing population will reduce relative demand for education services across the country and the school and university infrastructure needed to support it, but increase the relative demand for healthcare services and hospital infrastructure.
The ‘overs’ and ‘unders’ are likely to balance out. Some sectors will experience rising investment demand, as a share of GDP, while others will require a smaller share of GDP due to demographic and other changes. If we rebalance investment towards sectors with growing investment needs our infrastructure budget should remain affordable.
The mix of investment between and within sectors will change
Table 2: Sector-level capital investment demand and key drivers

Note: The infrastructure networks highlighted in our analysis are based upon those categories and definitions of infrastructure from our 2024 Research Insights paper, ‘Build or Maintain: New Zealand’s infrastructure asset value, investment, and depreciation, 1990–2022’. Those definitions are drawn from Stats NZ data from New Zealand’s national accounts. In some cases these categories do not neatly correspond to other, more detailed infrastructure sector classifications. Source: 'Forward Guidance on Infrastructure Investment'. New Zealand Infrastructure Commission. (2026).
More funding goes into electricity and health to meet growing demand
We identify two sectors with a rising share of infrastructure investment.
Electricity: We expect electricity infrastructure investment demand to increase due to technological changes and the need to decarbonise our economy. While this investment can be funded commercially from user charges, government policy will affect how much investment is demanded and how rapidly it can be supplied.
Hospitals: We expect investment demand for hospital infrastructure to increase due to the need to renew and replace ageing hospitals and expand hospital services to serve the growing needs of an ageing population. While there are options about how to deliver additional hospital services, central government is expected to fund these through taxes. Hospitals and other health services are also seen as crucial in addressing health inequities between Māori and non-Māori, with Māori facing higher rates of chronic disease, injury and lower life expectancy.40

![]()
Priority for the decade ahead
Lift hospital investment for an ageing population
Forward Guidance: Between 2010 and 2022, New Zealand spent around 0.2% of GDP per year on health infrastructure. We expect this to rise to around 0.4% for the next 30 years, driven by the need to renew the ageing hospital estate and expand capacity to meet the needs of an older population.
What’s the problem?
The health system is already under strain. Health New Zealand/Te Whatu Ora manages more than 1,200 buildings, with an average building age of 47 years.41 Low levels of investment and inconsistent asset management practices mean many hospitals are in poor condition and no longer meet modern clinical standards. Large parts of the network are nearing the end of their usable lives and will need to be rebuilt or remediated.
Demand pressures are also rising. The number of New Zealanders aged 65 and over is projected to grow from around 900,000 in 2025 to more than 1.5 million by the early 2050s. Older people use more healthcare, meaning we face a growing capacity shortfall. Under current models of care, Health New Zealand projects that around 4,900 additional hospital beds may be needed by 2043 to meet demand.
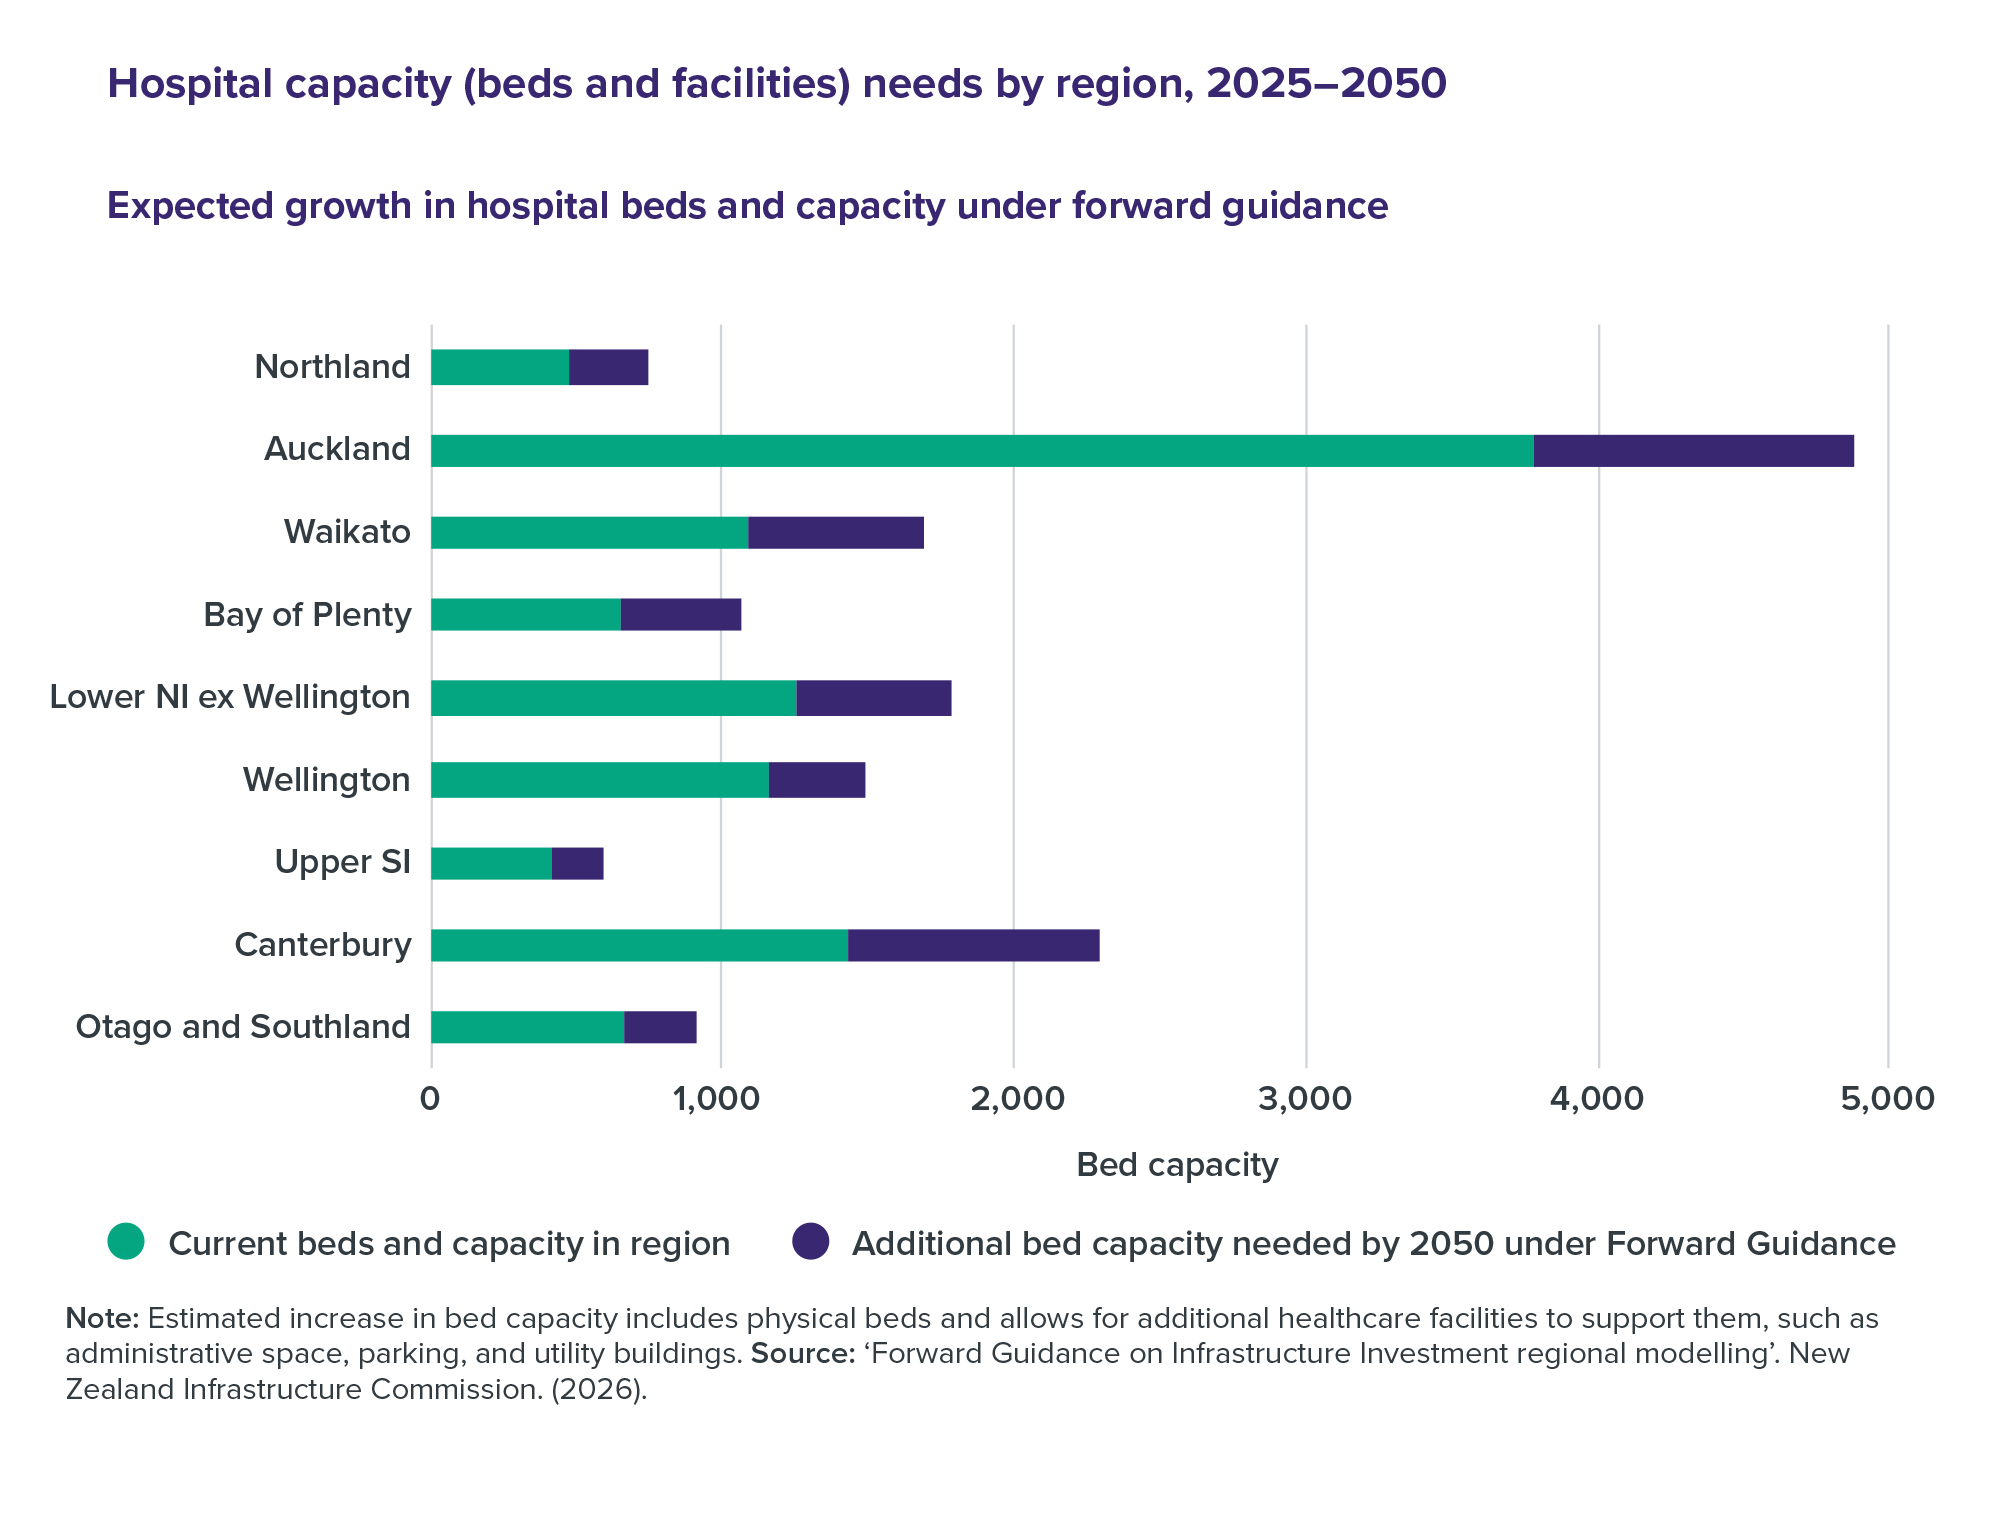
Balancing hospital renewal and expansion will be one of New Zealand’s most significant public investment challenges. Through the Infrastructure Priorities Programme, the Commission has endorsed the need to investigate upgrades to Tauranga, Palmerston North and Hawke’s Bay hospitals. However, all regions will need more investment, with the greatest pressure coming in large centres. For instance, our Forward Guidance projects we will need 1,100 additional beds and other health facilities in Auckland alone by 2050 under current models of care. This is the equivalent of building a second Auckland City Hospital, the largest in the country.
If we can deliver new capacity at affordable costs consistent with past projects and international benchmarks – and make greater use of non-hospital care options – we can meet healthcare needs while preserving affordability. Doing so will require disciplined sequencing, strong oversight of major projects, and consistent funding for maintenance and renewal.
Figure 16: Hospital capacity (beds and facilities) needs by region, 2025–2050
Expected growth in hospital beds and capacity under Forward Guidance

Note: Estimated increase in bed capacity includes physical beds and allows for additional healthcare facilities to support them, such as administrative space, parking, and utility buildings. Source: ‘Forward Guidance on Infrastructure Investment regional modelling’. New Zealand Infrastructure Commission. (2026).
Key actions
- Shift demand where possible to non-hospital care. Resourcing primary care providers and expanding community-based and lower-cost service options can help reduce pressure on inpatient beds and defer expensive hospital builds.
- Use Forward Guidance to anchor capital planning. The Government should assess Health New Zealand's Health Infrastructure Plan for alignment with sustainable long-term investment levels and ensure its fiscal strategy considers the funding requirements necessary to deliver on the Plan.
- Direct limited capital to the highest-need regions and projects. Demand projections, cost benchmarking and the Infrastructure Priorities Programme should guide decisions about where funding will have the greatest impact.
- Improve value from major projects. Health New Zealand should use standardised designs, strengthen project governance, and partner strategically with industry. Digital tools should be prioritised where they improve productivity or reduce operating pressure.
- Ringfence dedicated renewals funding. Decision-makers should protect capital set aside for rebuilding or remediating deteriorated assets from operational cost pressures, with clearer separation between clinical service funding and asset funding.
Spending slows in water, land transport and education as these sectors stabilise
Growing investment in health and electricity will need to be balanced out by declining relative spend in three other sectors. Reducing the share of GDP we invest in these areas will help address the fiscal and affordability pressures resulting from an ageing population.
- Land transport: Investment in land transport (road, public transport, and rail) has been elevated over the past 20 years. An ageing population is expected to reduce travel demand in most areas of the country, while income growth will put limits on investments to enhance the service levels of the network. Decarbonising our economy may also shift the mix of land transport investment, if it reduces demand for roads and increases demand for public transport and active modes like walking and cycling. A lower relative level of capital investment means we could continue to meet our needs with user charges, rather than requiring top-ups out of general tax revenue as has happened in recent years.
- Education: We expect overall investment demand for education infrastructure to moderate as the population ages. We note, however, there are likely to be significant regional variations in demand, with greater pressures in areas like Auckland, Waikato and Canterbury.
- Water and waste: After completing a period of ‘catch up’ investment to renew pipes in poor condition and improve drinking water quality and wastewater network performance, we expect water and waste investment requirements to moderate over the medium to long term.
![]()
Priority for the decade ahead
Complete catch-up on renewals in the water sector and restore affordability
Forward Guidance: Between 2010 and 2022, New Zealand spent around 0.6% of GDP per year on water and wastewater infrastructure. We expect this to moderate to around 0.5% of GDP over the next 30 years as we complete catch-up renewals to lift asset condition and meet water quality standards.
What’s the problem?
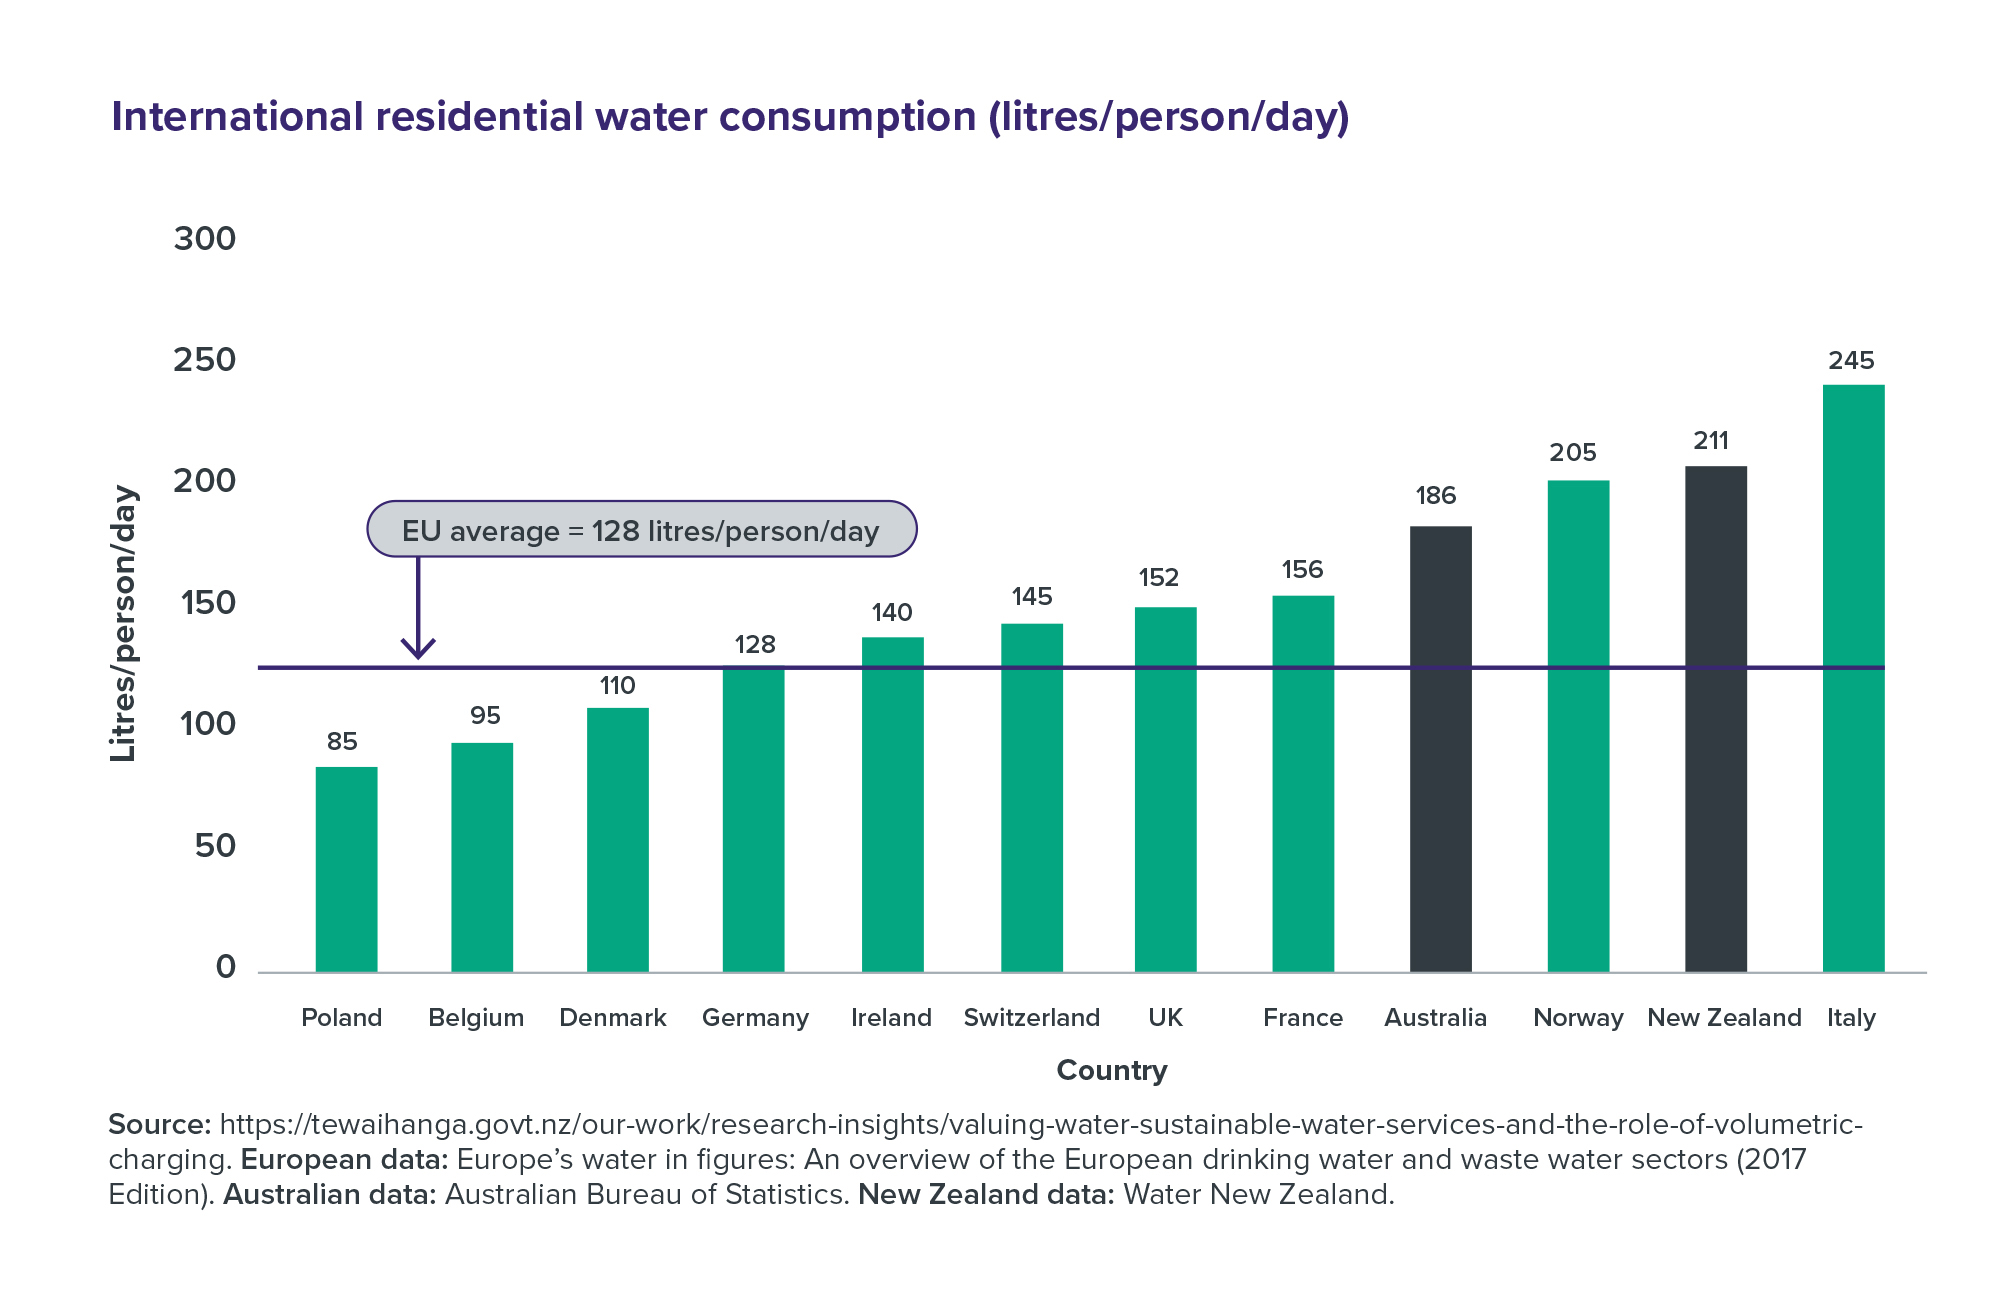
New Zealanders use more water and invest more in water-related infrastructure than almost any other high-income country. Over the next 10 years, councils are planning to spend close to $50 billion renewing and expanding their water networks.42 Household bills are expected to double in some instances. For context, we estimate that New Zealand spent about $50 billion cumulatively on water and wastewater infrastructure from 1885–2012, even after adjusting for inflation.
New Zealanders value access to clean, safe drinking water, which is considered a taonga in Te Ao Māori. However, sustaining our current, historically high levels of investment will be unaffordable for some communities and come at the expense of other local priorities, such as parks and libraries.
Figure 17: International residential water consumption (litres/person/day)

Source: https://tewaihanga.govt.nz/our-work/research-insights/valuing-water-sustainable-water-services-and-the-role-of-volumetriccharging. European data: Europe’s water in figures: An overview of the European drinking water and waste water sectors (2017 Edition). Australian data: Australian Bureau of Statistics. New Zealand data: Water New Zealand.
For a period of almost 20 years from the mid-1970s, New Zealand spent less on water infrastructure than the rate of depreciation, meaning our pipes and treatment plants wore out faster than we replaced them. Councils are now dealing with a legacy of broken pipes, sewage overflows and leaks, as well as a need to invest to meet quality standards set by the Water Services Authority – Taumata Arowai. What they’re planning to spend on repairs and replacements is largely in line with our Forward Guidance, but councils are also contemplating significant investments on water infrastructure to support housing growth or improve service levels.
Through the Infrastructure Priorities Programme, the Commission has endorsed the need to investigate water and wastewater infrastructure needs in several urban areas, while emphasising the importance of exploring lower-cost and non-built solutions, including managing demand through volumetric charging. Water service entities are increasingly exploring options to address investment affordability challenges. For example, one North Island council had to consider cheaper options after it consulted its community on a $640 million wastewater treatment plant, which would have cost households at least $1,000 a year once it came into effect.43
Key actions
- Encourage councils and water services providers to consider installing water meters and adopting volumetric pricing. This can moderate demand, help identify leaks, and defer the need for costly new investment.
- Ensure regulatory coordination. The Commerce Commission, the Water Services Authority – Taumata Arowai and regional councils will need to work together to ensure the safety, quality, environmental compliance and value for money of water sector investments.
- Encourage councils to submit water investment proposals for assessment through the Infrastructure Priorities Programme. This will ensure all options, including low-cost and non-built solutions, are considered before projects go ahead.
Sectors that are harder to predict are watched closely to guide future planning
Demand for new justice and defence infrastructure is inherently difficult to predict. While the need to maintain and renew existing justice and defence estate infrastructure has been clearly identified, future growth is shaped by policy choices and geopolitical developments that are far harder to forecast. To support long-term planning, the Commission has developed indicative guidance for these sectors based on 100-year trends in overall central government spending in these areas (see Appendix One). This represents the level of investment needed to maintain and renew current assets while allowing for population-driven pressures and reasonable improvements in service standards. The Commission will continue to refine and expand its Forward Guidance for these and other sectors.
Investment reflects the needs and priorities of different regions and communities
Our forecasts focus on overall national investment demands in each sector and the mix of factors that will drive investment. The spending ranges of our projections are sufficient to meet different demands over time, if projects and programmes are prioritised and delivered efficiently. However, the long-term trends will have different impacts on investment demands in different places, and for different communities.
The Commission has carried out high-level regional modelling to understand how infrastructure networks in different parts of the country might grow and evolve over time. Without more detailed information on the value and condition of assets by region, we can’t say exactly what investment will be required when. But we can take our Forward Guidance – which says infrastructure spending will increase from just over $20 billion a year now to more than $40 billion in the 2050s – and show what that would mean for the value of different infrastructure networks by region.
Every region will have more infrastructure in 2050 than it does today, but this growth won’t be evenly distributed around the country. The dollar value of infrastructure networks in fast-growing parts of the country like Auckland will increase at a greater pace than slow-growing regions over the next 30 years. This isn’t to say places like the West Coast won’t require new investment, just that the overall value of their infrastructure networks will grow more slowly. For these regions, maintaining and renewing their existing assets will take on even greater importance.
Some infrastructure networks will need to grow faster to accommodate rapidly growing demand. This is particularly true of hospitals, where every region is expected to have growing demand. For some regions, like Nelson and Tasman, the demand for new health facilities will mostly be driven by a population that is ageing faster than the rest of the country. However, in regions like Auckland, the Waikato, and Canterbury, more health facilities will be needed to serve not just ageing populations, but a growing population in general.
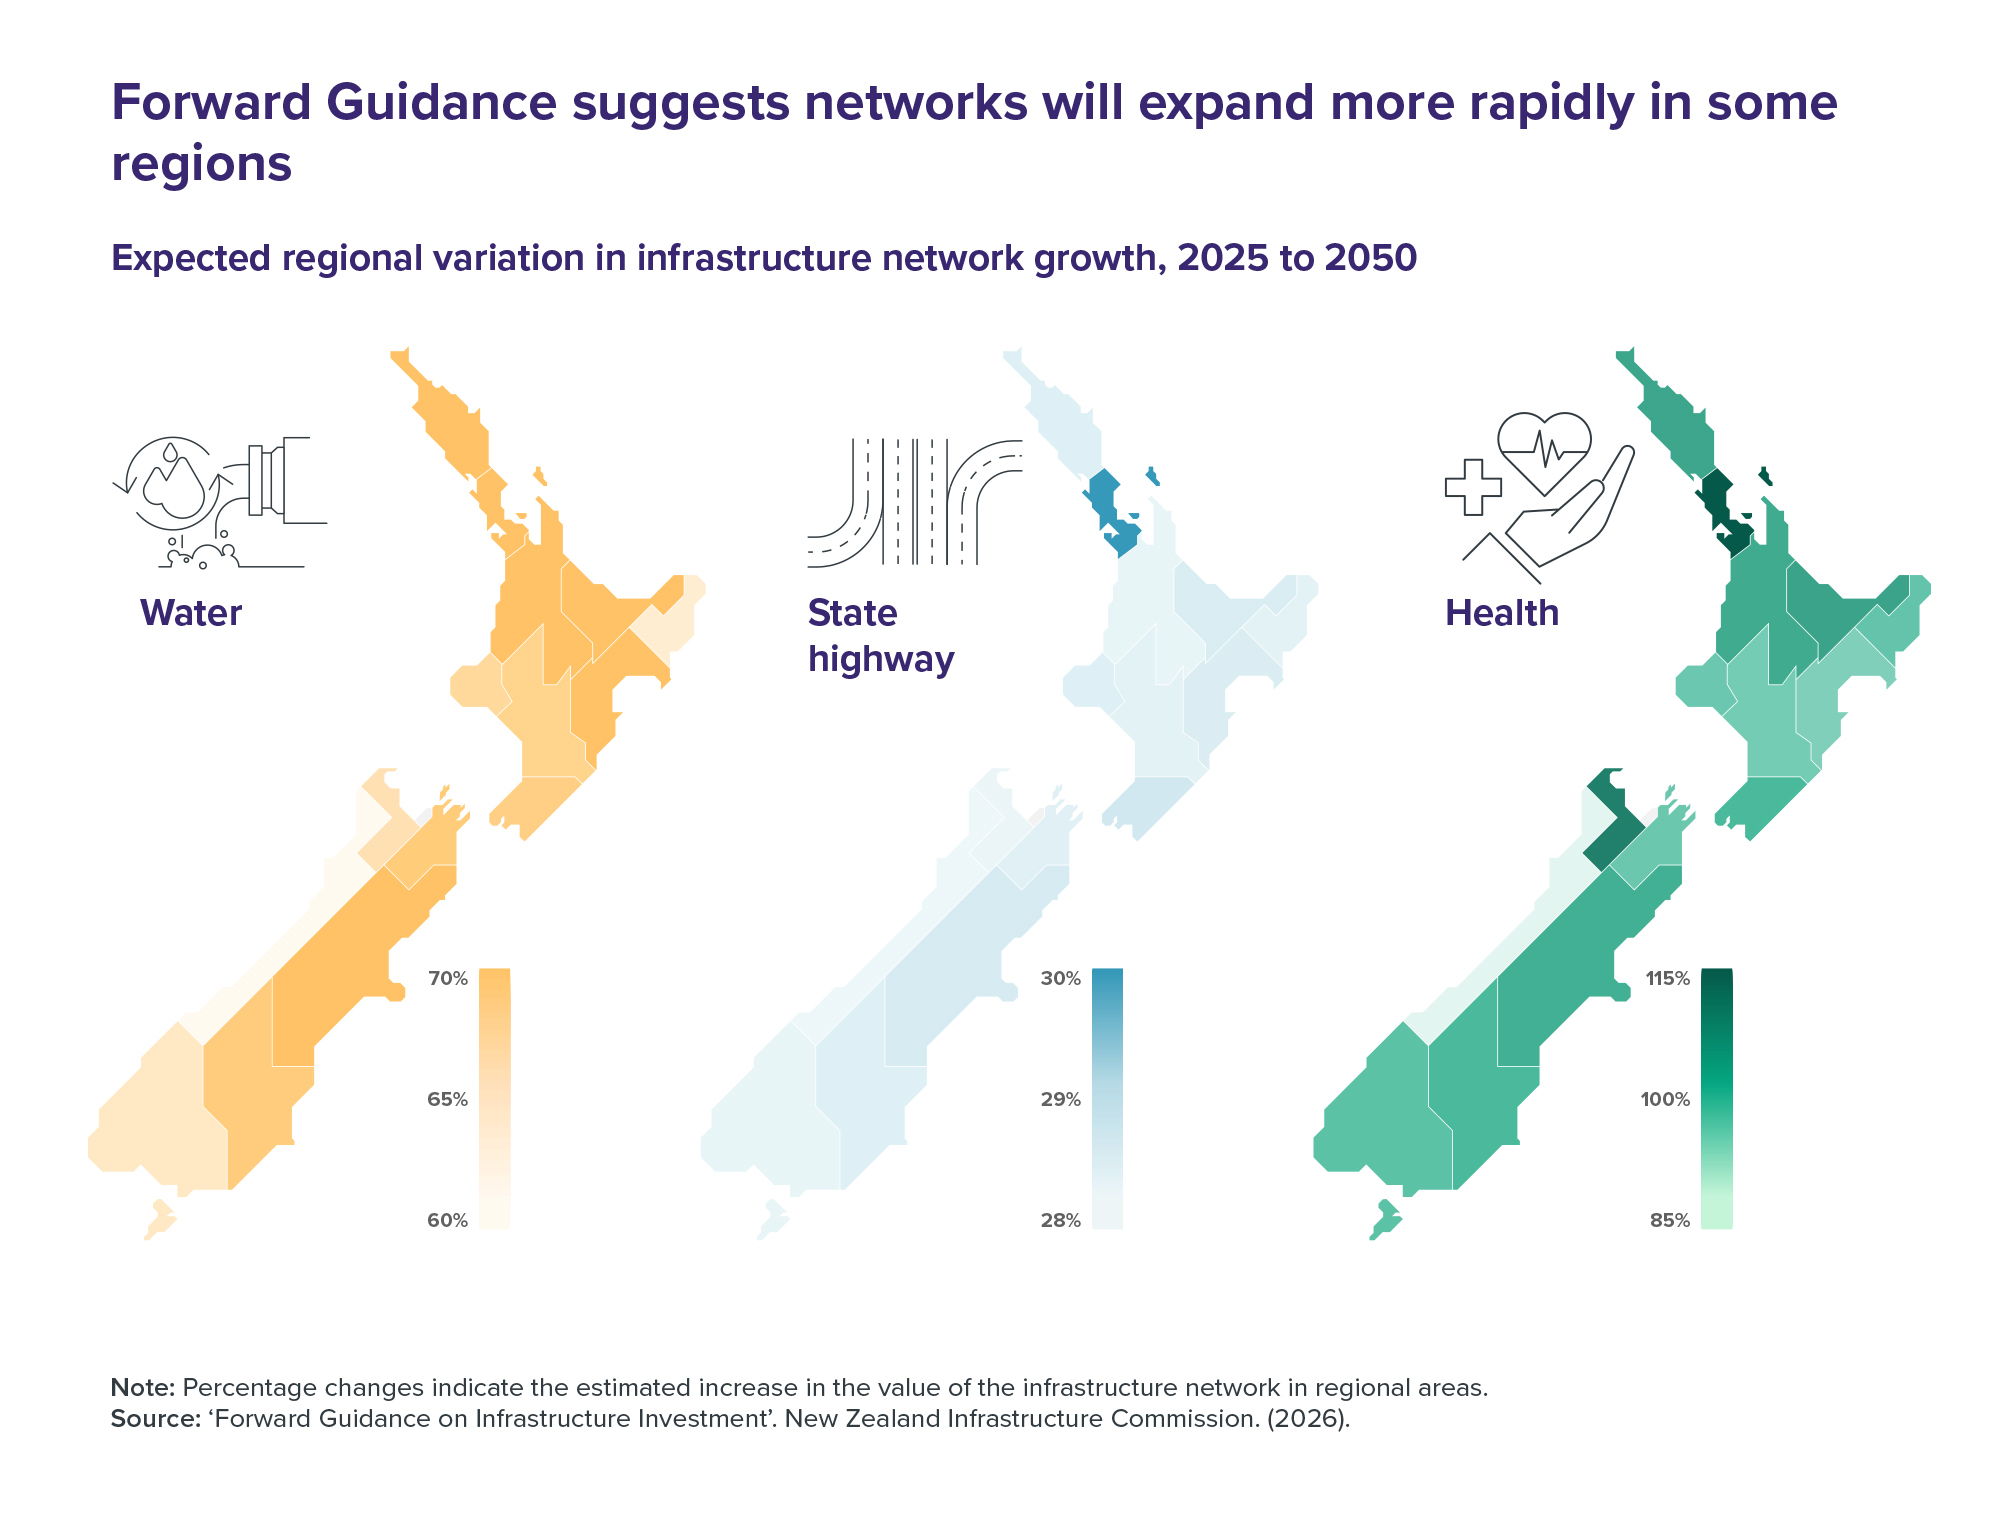
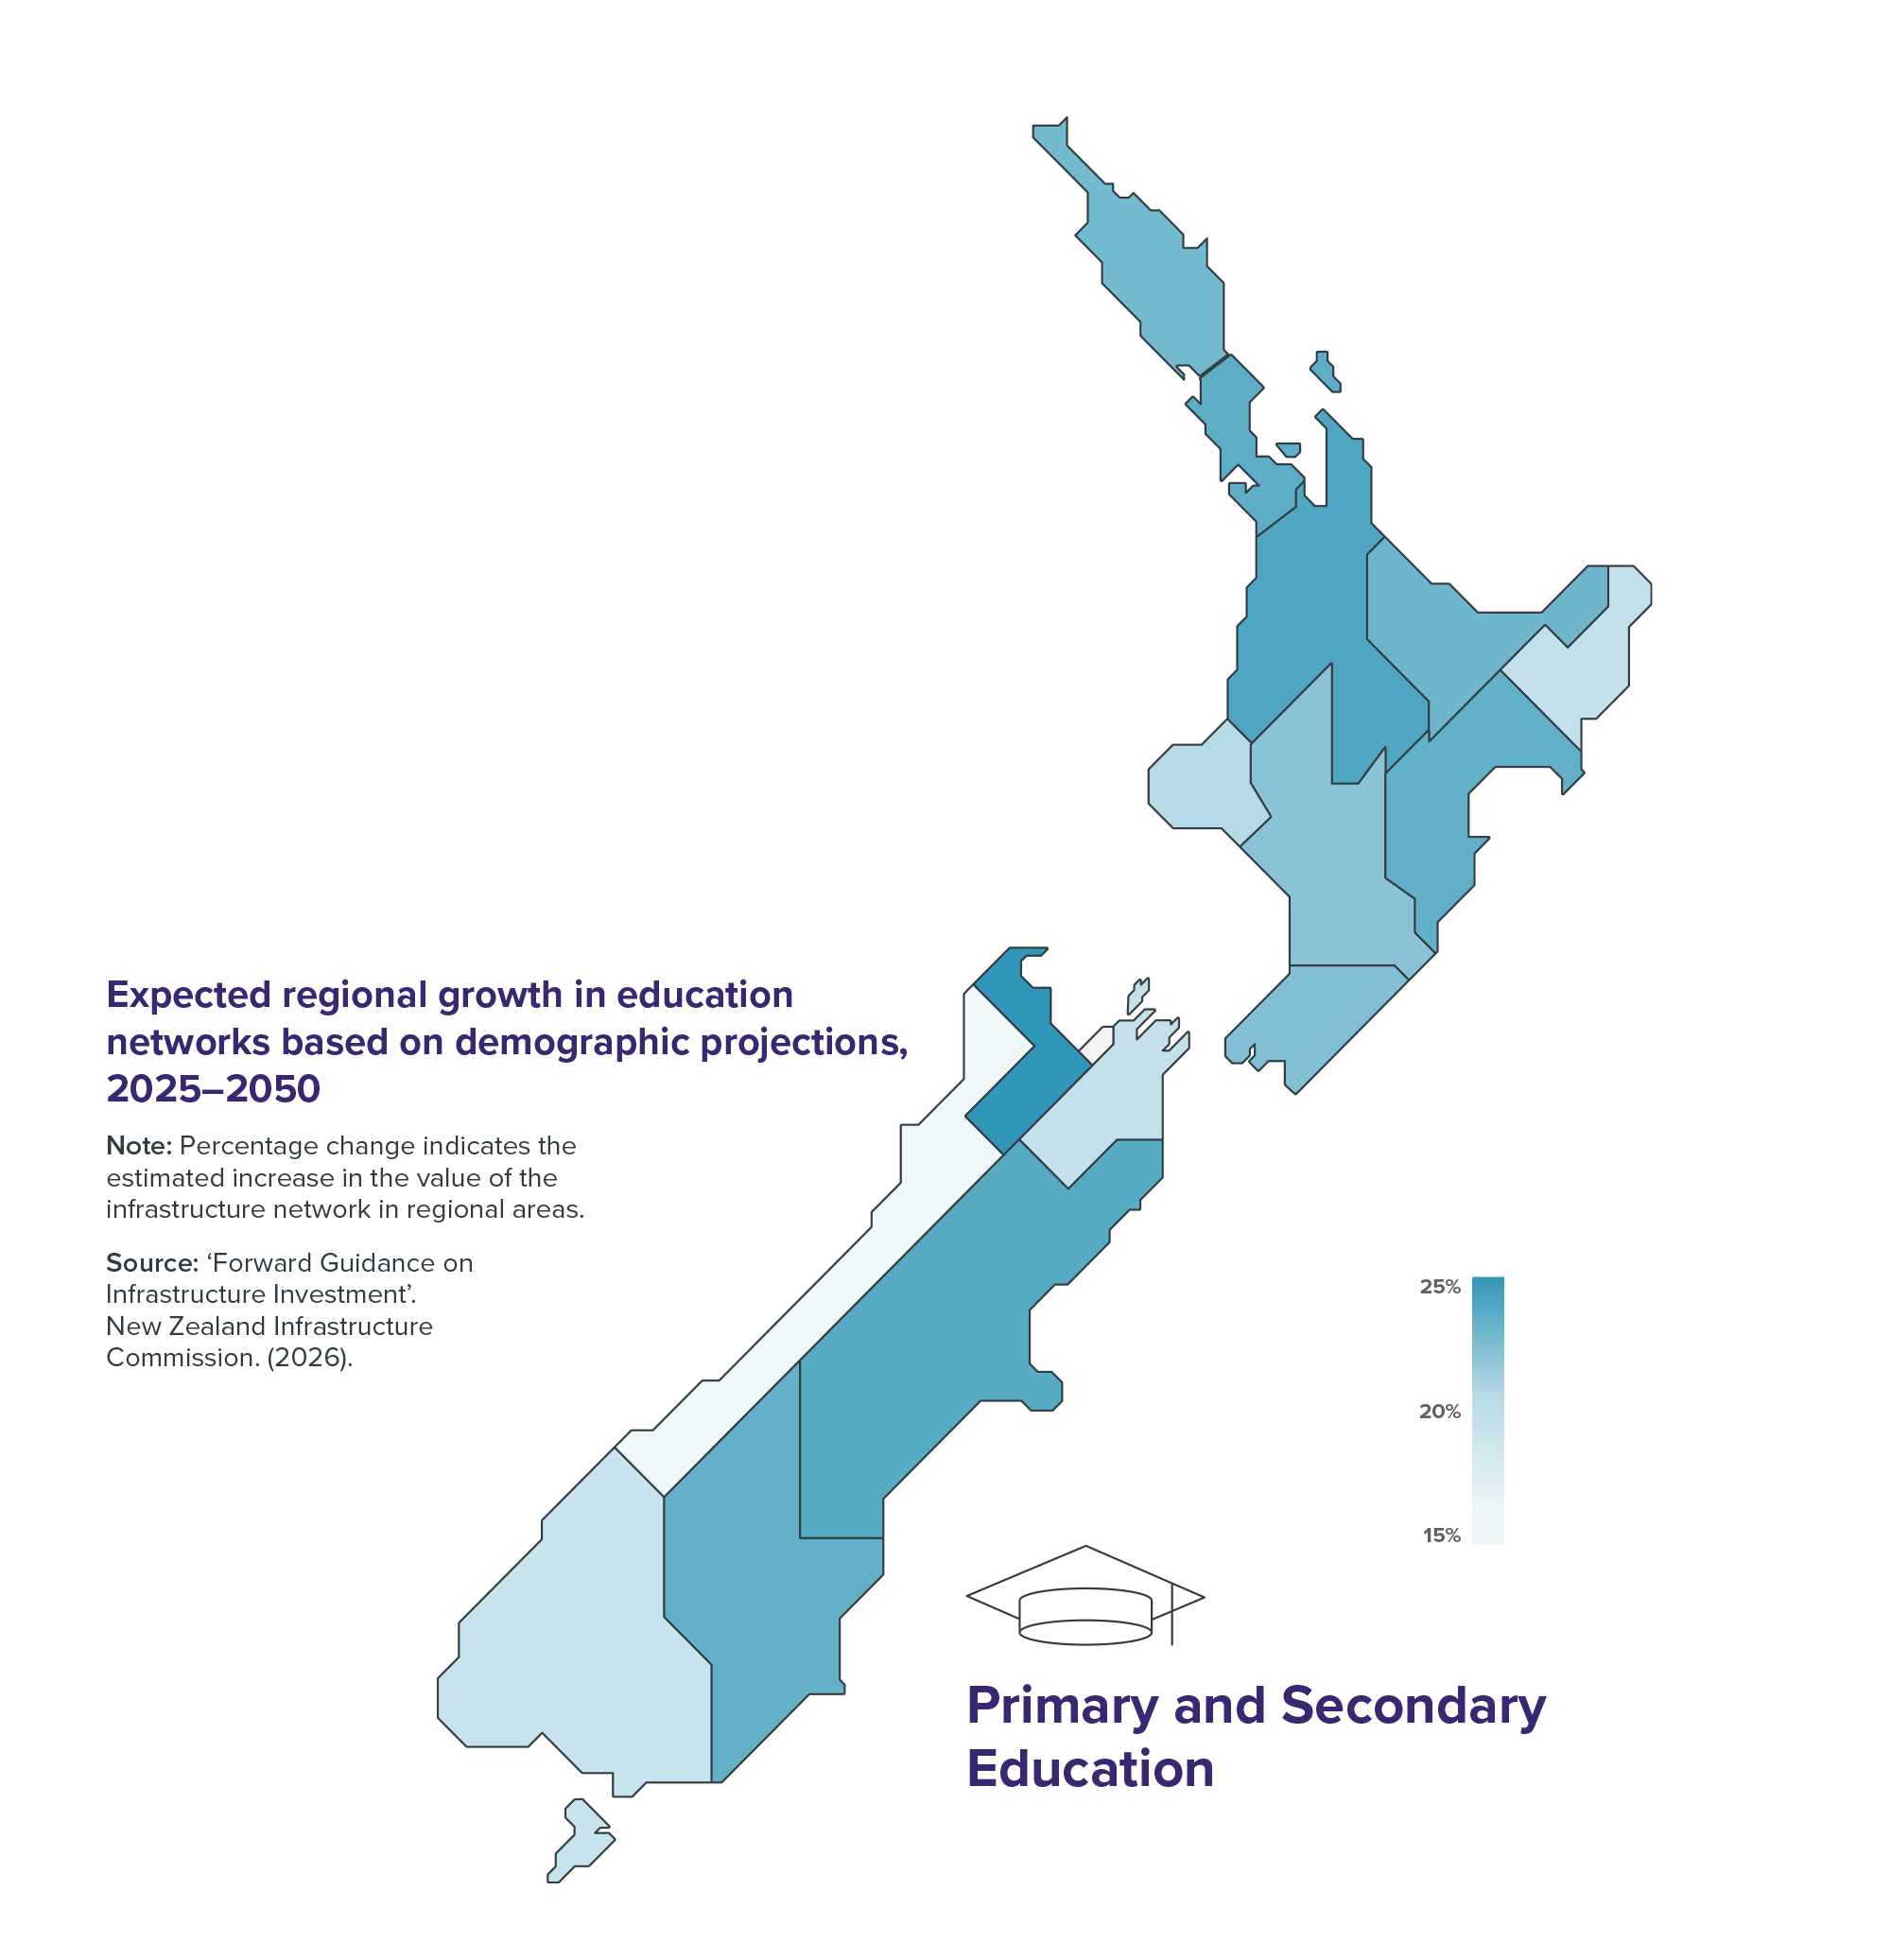
Even in sectors where our Forward Guidance suggests investment will moderate, there will be regional hotspots. In education, for instance, investment as a share of GDP is expected to decline over the next 30 years as the number of school-age tamariki (children) plateaus. But in regions such as Northland and the East Coast of the North Island, our regional modelling shows rising demand. These areas have large Māori populations, who have a younger age profile – 27.2 years on average, compared with the national average of 38.1. More tamariki means greater demand for education infrastructure (Figure 18).
Forward Guidance suggests networks will expand more rapidly in some regions
Figure 18: Expected regional variation in infrastructure network growth, 2025 to 2050

Note: Percentage changes indicate the estimated increase in the value of the infrastructure network in regional areas. Source: 'Forward Guidance on Infrastructure Investment'. New Zealand Infrastructure Commission. (2026).
Not all infrastructure demand is driven by population growth. State highways, for example, have historically been built to connect towns and cities rather than to match local population growth. Our Forward Guidance supports this, as it shows similar growth in regional highway networks despite differing population trends. Tourism is another important driver: regions with high seasonal visitor numbers face growing pressure on infrastructure, often with small resident populations to support the required investment.
![]()
Box 2
Drivers of demand for future investment needs may affect Māori differently
The infrastructure needs of Māori communities often differ from those of the wider population. While our forecasts present an overall picture of future investment needs, the outlook for Māori diverges in important ways.
Māori are a younger and faster-growing population than the national average. This creates greater demand for schools in regions with higher Māori populations, both to accommodate student growth and to expand access to Māori immersion education and kura.
We also expect these areas to require more health facilities. Younger populations tend to grow more quickly overall, increasing demand for hospitals and other services. Children aged 0–4, for example, use health facilities at nearly twice the rate of 40-year-olds.
Figure 19: Expected regional growth in education networks based on demographic projections, 2025–2050

Note: Percentage change indicates the estimated increase in the value of the infrastructure network in regional areas. Source: ‘Forward Guidance on Infrastructure Investment’. New Zealand Infrastructure Commission. (2026).
Many marae are in hazard-prone locations, which can affect access and resilience. While our existing analysis can begin to show these impacts, further work is needed to understand them fully.
Finally, some infrastructure decisions can limit the ability of Māori to exercise kaitiakitanga (guardianship) over te taiao (the natural environment) or disrupt connections to whenua (land), both of which are central to Māori wellbeing.
Spending decisions take household costs and living pressures into account
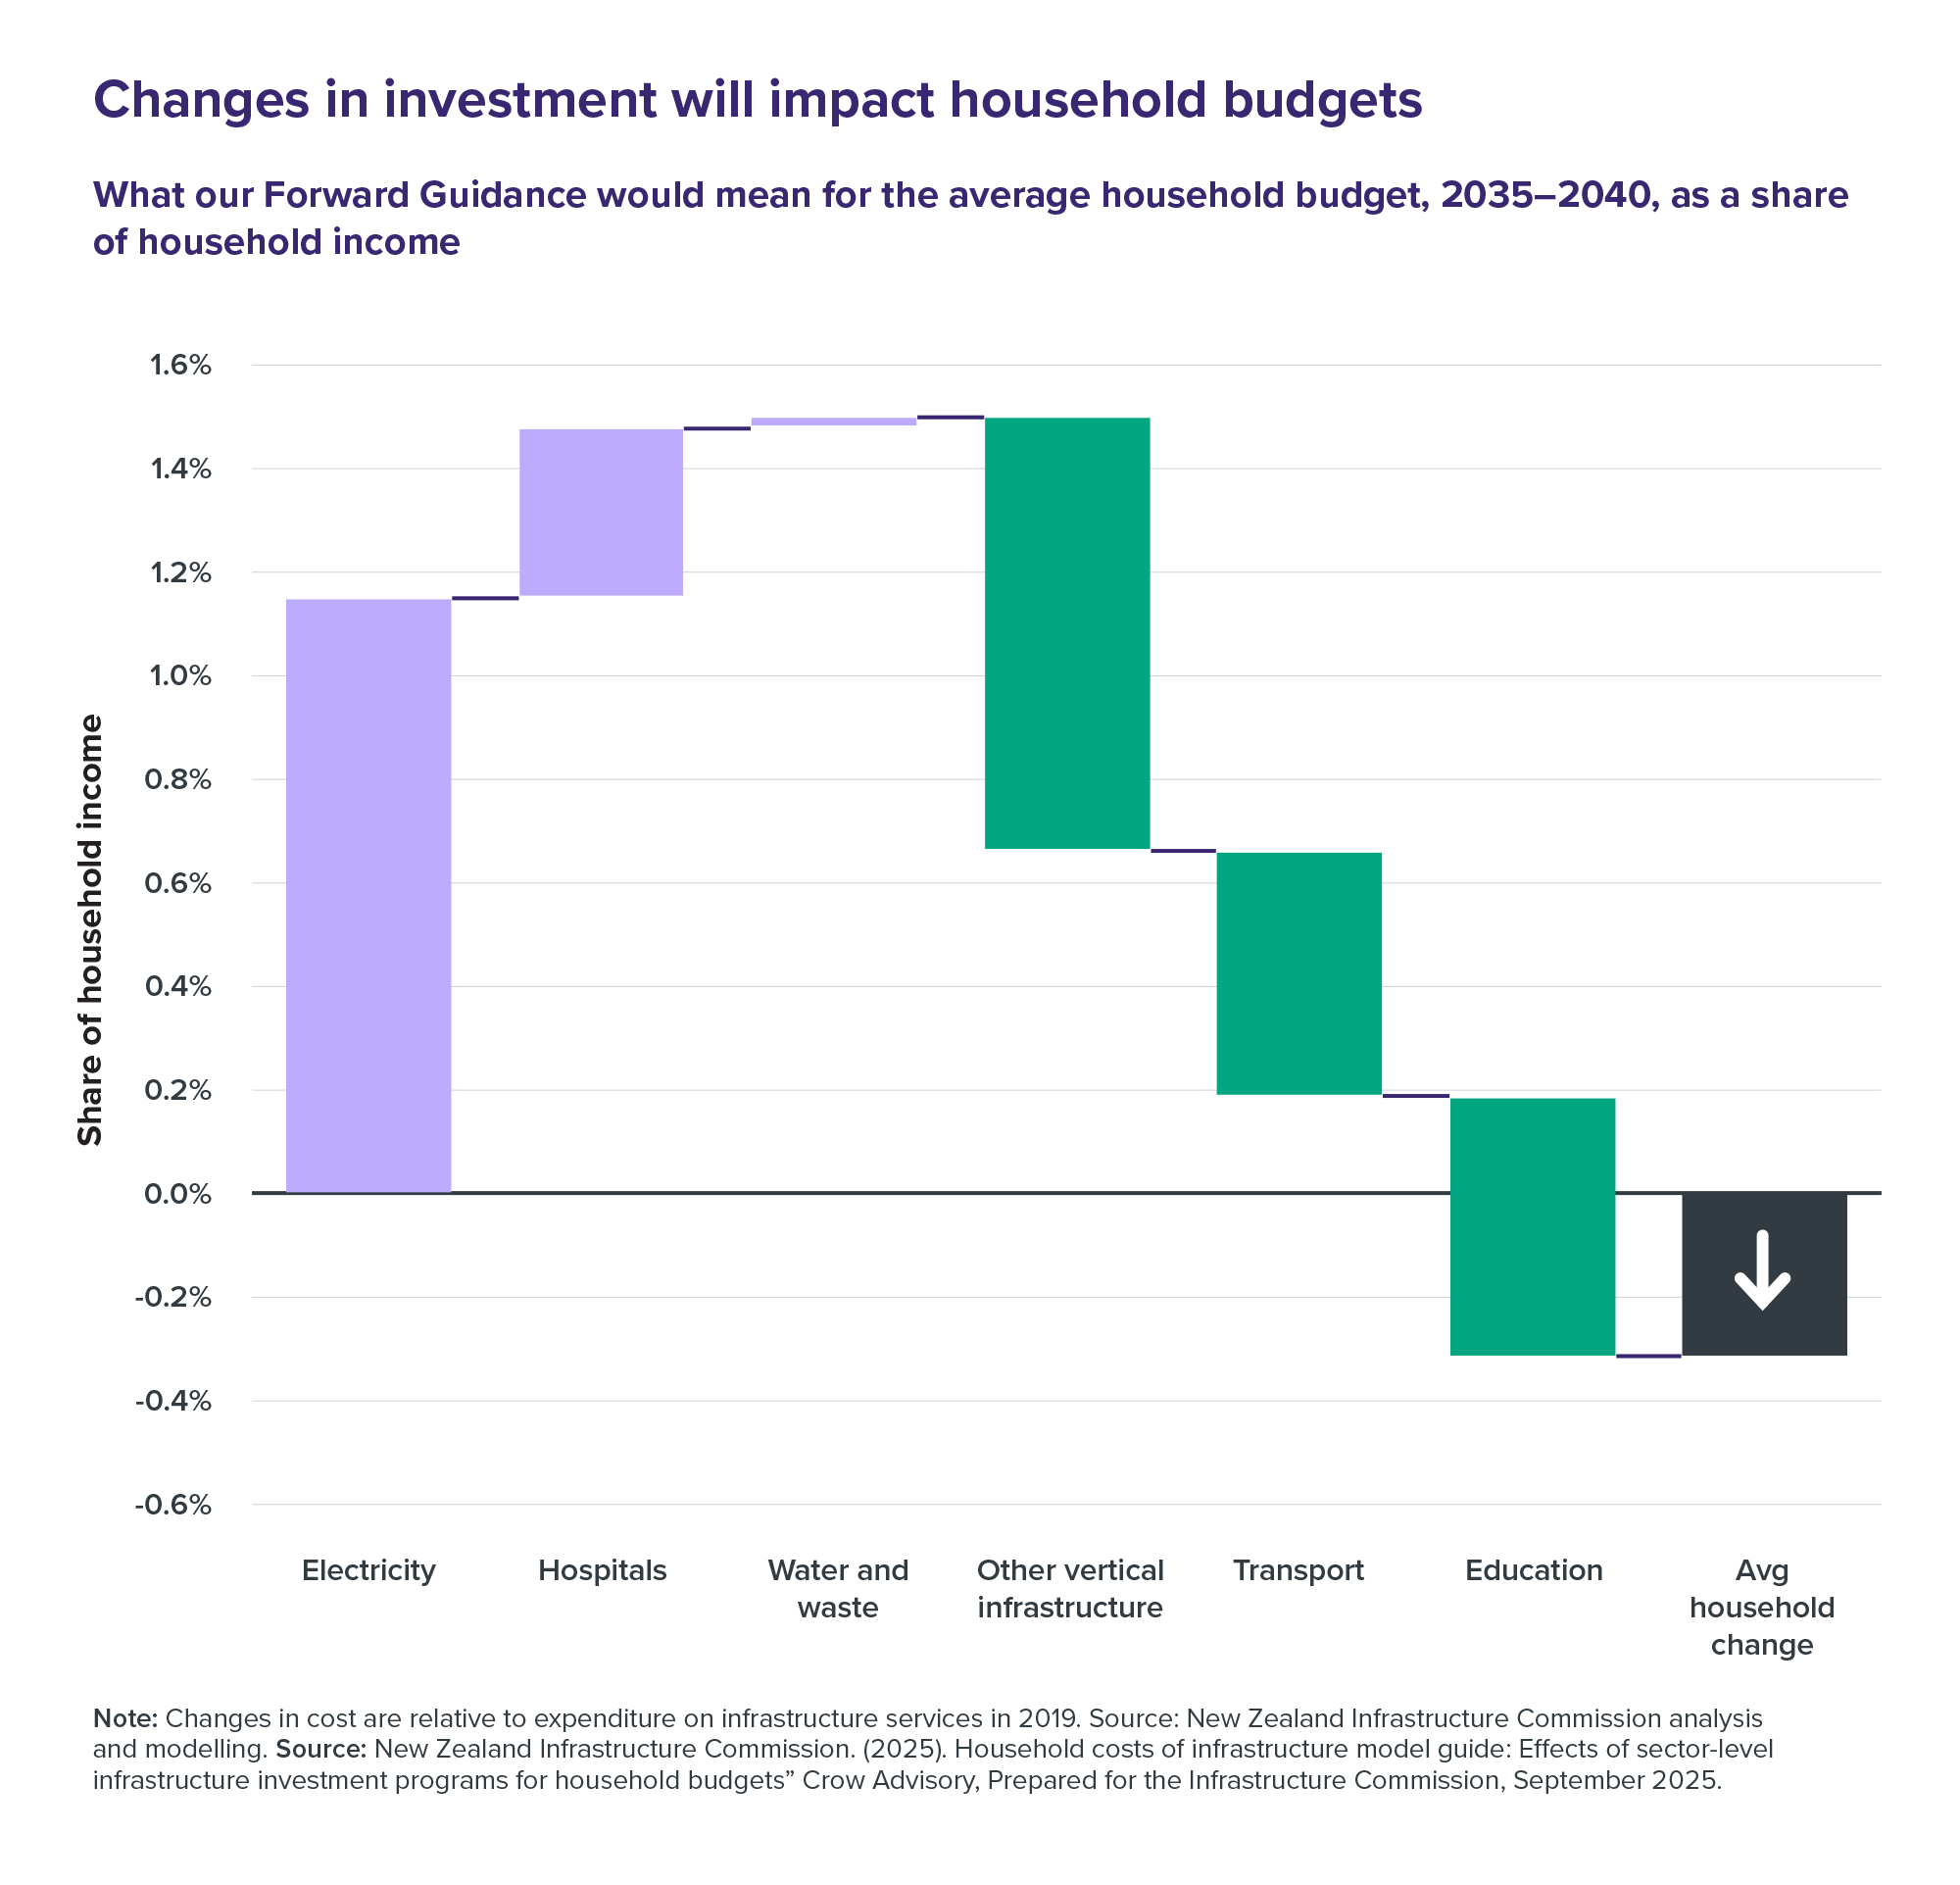
We have choices about how we fund and finance infrastructure investment. But New Zealanders will ultimately still have to pay. Households will meet some costs through taxes, rates, or user charges. Other costs will be met by businesses and passed on to local or international customers. To understand whether our Forward Guidance is likely to be affordable for New Zealanders, the Commission has modelled the impact of different scenarios on household budgets (Figure 20).
If implemented, our Forward Guidance would require households to pay slightly lower levels of charges and taxes in the medium term than they have in recent years. However, the composition will change. We expect higher electricity charges to fund new generation required to meet our decarbonisation targets in the next 10 to 15 years. Critically, to ensure the long-run affordability of this increase in investment, central government will need to pull back investment levels in land transport and education in response to lower overall demand. We also expect that rising charges to fund this investment will be offset by lower household expenses on goods such as petrol, which we do not model.44, 45
Changes in investment will impact household budgets
Figure 20: What our Forward Guidance would mean for the average household budget, 2035–2040, as a share of household income

Note: Changes in cost are relative to expenditure on infrastructure services in 2019. Source: New Zealand Infrastructure Commission analysis and modelling. Source: New Zealand Infrastructure Commission. (2025). Household costs of infrastructure model guide: Effects of sector-level infrastructure investment programs for household budgets” Crow Advisory, Prepared for the Infrastructure Commission, September 2025
![]()
Recommendation 1
Needs-based capital allowances
Ensure fiscal strategy and capital allowances are informed by the Commission’s independent assessment of long-term needs and agencies' infrastructure asset management and investment plans.
Implementation pathway
This could be implemented by:
- The Commission providing the Treasury with periodic forecasts of central government infrastructure needs.
- Incorporating these forecasts into fiscal strategy advice and decisions on future capital and operating allowances.
- Using agency asset management and investment plans to inform indicative allocation of future capital allowances across sectors and agencies.
Responsible agencies
The Treasury, New Zealand Infrastructure Commission, capital-intensive agencies
Timeframe
2026 onwards.