Content
Content
Draft National Infrastructure Plan
7.3. Water and waste | Te wai me te para
7.3.1. Institutional structure
Service delivery responsibilities
- The water and waste sector includes drinking water, wastewater, and stormwater infrastructure and services; river control and flood protection; and solid waste management. It also includes irrigation, which we discuss briefly but do not include in our investment demand analysis.
- Territorial local authorities provide most drinking water, wastewater and stormwater services, although there is some community self-supply and private sector provision. Regional councils provide river control and flood protection infrastructure.
- Irrigation infrastructure and services are provided by a variety of private and user-owned schemes, sometimes with a degree of local government involvement.
- Solid waste infrastructure and services are provided by both territorial local authorities and private firms.
Governance and oversight
- The Water Services Authority – Taumata Arowai regulates drinking water safety. The Commerce Commission has been tasked with economic regulation for drinking and wastewater services, starting with oversight of Watercare, which provides water services to the Auckland region.
- Regional councils regulate freshwater and coastal water quality under the Resource Management Act 1991 and relevant national direction.
- The Department of Internal Affairs and Ministry for the Environment provide policy stewardship for the water sector and waste sector respectively.
7.3.2. Paying for investment
Local government water services
- Around 57% of users are charged through volumetric water charges, with the balance charged through rates on connected properties.
- Stormwater provision is typically provided through rates or targeted rates.
- In recent years, some central government grants have supported water services, but this is not a persistent feature of the funding model.
Solid waste services
- Solid waste services are paid through a combination of council rates and disposal levies charged to those who create and dispose of waste.
- Central government applies a waste disposal levy for each tonne of waste deposited in most landfills. These funds are used by government and councils to support waste minimisation efforts.
7.3.3. Historical investment drivers
- During the late 1800s and early 1900s, water networks were built in response to technological innovations (indoor plumbing, flush toilets), public health drivers (reducing waterborne diseases in urban areas) and population growth.
- Servicing growth and maintaining and renewing the existing network has been the focus of a significant amount of investment since the early 2000s.
- Rising standards, both environmental and health, for drinking and wastewater have driven growth in investment recently.
- Stormwater investment has lifted in recent years after the separation of wastewater and stormwater networks, and additional council focus on flood risk mitigation.
7.3.4. Community perceptions and expectations
- Survey data suggests that having enough clean water, particularly safe drinking water, is an important priority for New Zealanders.
- Although New Zealanders rate the quality of our water and sewerage systems about the same as people in other countries, New Zealanders still perceive it as an investment priority.
- New Zealand’s flood protection infrastructure is rated as a priority for just under half of New Zealanders, according to one survey.
7.3.5. Current state of network
New Zealand’s difference from comparator country average
|
Network |
Investment |
Quantity of infrastructure |
Usage |
Quality |
|
Water |
+70% |
-3% |
+99% |
-9% |
Comparator countries: Chile, Greece, Spain, Czechia, Canada, Finland, Sweden, Iceland. Similarity based on: Income, population density, terrain ruggedness, urban populations, total population. Percentage differences from comparator country averages are based on a simple unweighted average of multiple measures for each outcome. Further information on these comparisons is available in a supporting technical report.[106]
- After being one of the lowest spending countries from 1980-1995, New Zealand’s investment in water is now among the highest in the OECD, and much higher than most of our comparator countries.
- Relative to comparator countries, New Zealand’s water network is similarly sized in terms of length but has fewer connections. Despite relatively low connections, New Zealand uses 253 cubic meters of drinking water per capita annually, considerably higher than all comparator countries.
- While parts of our water network have high leakage rates, average national leakage rates are similar to the comparator country average.
- The Commission also publishes performance dashboards that can be used to understand changes in the performance of New Zealand’s water sector over time.[107]
7.3.6. Forward guidance for capital investment demand
|
Water and waste |
2025–2035 |
2035–2045 |
2045–2055 |
2010-2022 historical average |
|
Average annual spending 2023 NZD) |
$1.8 billion |
$2.2 billion |
$2.6 billion |
$1.7 billion |
|
Percent of GDP |
0.4% |
0.4% |
0.4% |
0.6% |
This table provides further detail on forward guidance summarised in Section 3. Further information on this analysis and the underlying modelling assumptions is provided in a supporting technical report.[108]
- Investment in water and waste infrastructure in New Zealand has been elevated (and nearly the highest in the world) as a share of GDP for the last 20 years, following a period of clear underinvestment from 1975 to 2000.
- In part, current investment levels are explained by backlogged renewal requirements, but this is unlikely to fully explain high investment. Other factors, such as rising quality standards, appear to play an important role.
- Going forward, renewal and replacement of existing infrastructure is expected to be the largest driver of investments. At a national level, slowing population and income growth is expected to flow through to declining demand for network expansions and improvement, although localised population will continue to drive high demand in some areas.
- Adapting to natural hazard risk is a growing investment driver for water networks. Flood control and stormwater infrastructure, including nature-based solutions, is likely to face challenges due to increasing extreme weather events.
7.3.7. Current investment intentions
- Water investment has risen in recent years. It is expected to remain high, based on infrastructure providers’ project intentions and programme-level investment intentions.
- The following chart shows that projected spending to deliver initiatives in planning and delivery in the Pipeline (blue bars) and programme-level intentions in local government Long Term Plans and central government’s reporting to the Treasury’s Investment Management System (red and orange bars) are significantly higher than the Commission’s investment demand outlook (black lines) over the 2025–2035 period.
- We note, however, that councils often do not deliver the full level of investment stated in their LTPs. We have indicated the level on the chart where 80% of planned investment reaches.
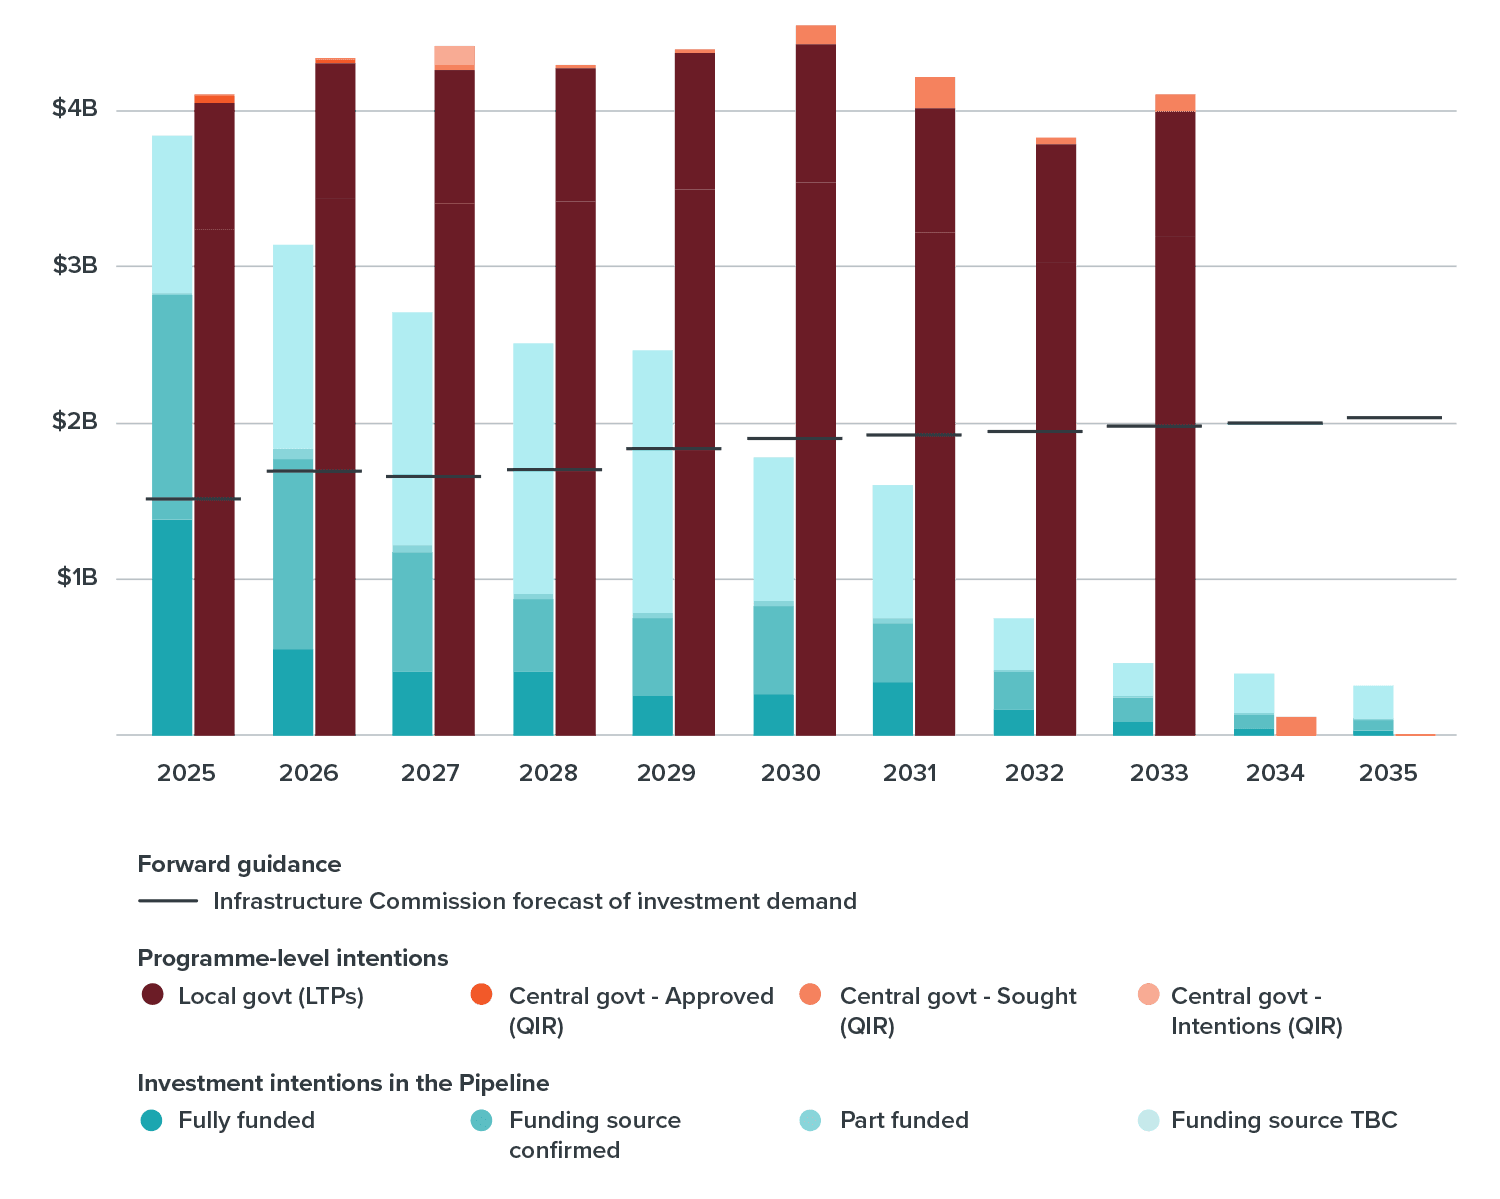
The chart compares two different measures of future investment intentions with the Commission’s forward guidance on investment demand. The blue bars show project level investment intentions from the National Infrastructure Plan, distinguishing based on funding status. The red and orange bars show an alternative measure of investment intentions based on programme-level data from local government Long Term Plans and central government’s reporting to the Treasury’s Investment Management System, again distinguishing by funding status. The black lines show the Commission’s forward guidance on investment demand.
7.3.8. Key issues and opportunities
- Pricing: There is an opportunity to better signal investment choices and usage. Volumetric water charging could be used to manage demand and reduce the need to construct new infrastructure to address growing water use.
- Governance and oversight: Economic regulation of drinking and wastewater services is an opportunity for the sector to ensure full-cost recovery, efficient investment programmes, and good asset management. It is also an opportunity to increase transparency on asset conditions and delivery performance.
- Coordination: The establishment of regional water service providers or council-controlled organisations for water, along with effective economic regulation, could enable a more effective response to investment needs.
- Regulatory and policy certainty: Changes in the direction of water reforms in recent years have influenced council water investment plans. Providing consistent policy and regulatory certainty will be key to enabling the transition to more efficient investment and delivery of water services.