
Read the National Infrastructure Plan
Read the Plan online or download a PDF.
Government response to the Plan
The Government has released its formal response to the National Infrastructure Plan. This marks a new phase for New Zealand’s infrastructure system.
Towards a thriving New Zealand
New Zealand is changing fast. Shifting demographics, the impacts of climate change, and technological innovations are all reshaping the demands on the hospitals, schools, water systems and transport networks that New Zealanders depend on every day.
New Zealand already invests heavily in infrastructure. But, when compared to other high-income countries, we are spending more and achieving less.
We spend a lot on infrastructure
From 2010-19 New Zealand was the biggest infrastructure investor in the OECD as a share of GDP.

We don't get bang for buck
We're near the bottom of OECD countries when it comes to investment efficiency.

We need to make changes
If we make no policy changes, by 2065 net Crown debt is forecast to reach 200% of GDP.
Planning for today and tomorrow
The National Infrastructure Plan sets out a practical, affordable pathway to deliver the infrastructure New Zealanders need to thrive over the next 30 years. It looks across the system, from hospitals, to roads, to water networks. It does this by combining long-term demand forecasting through our Forward Guidance with insights from the National Infrastructure Pipeline and the Infrastructure Priorities Programme.
The Plan identifies 16 recommendations across four areas where New Zealand needs to lift performance to achieve better outcomes:
-
Planning what we can afford
-
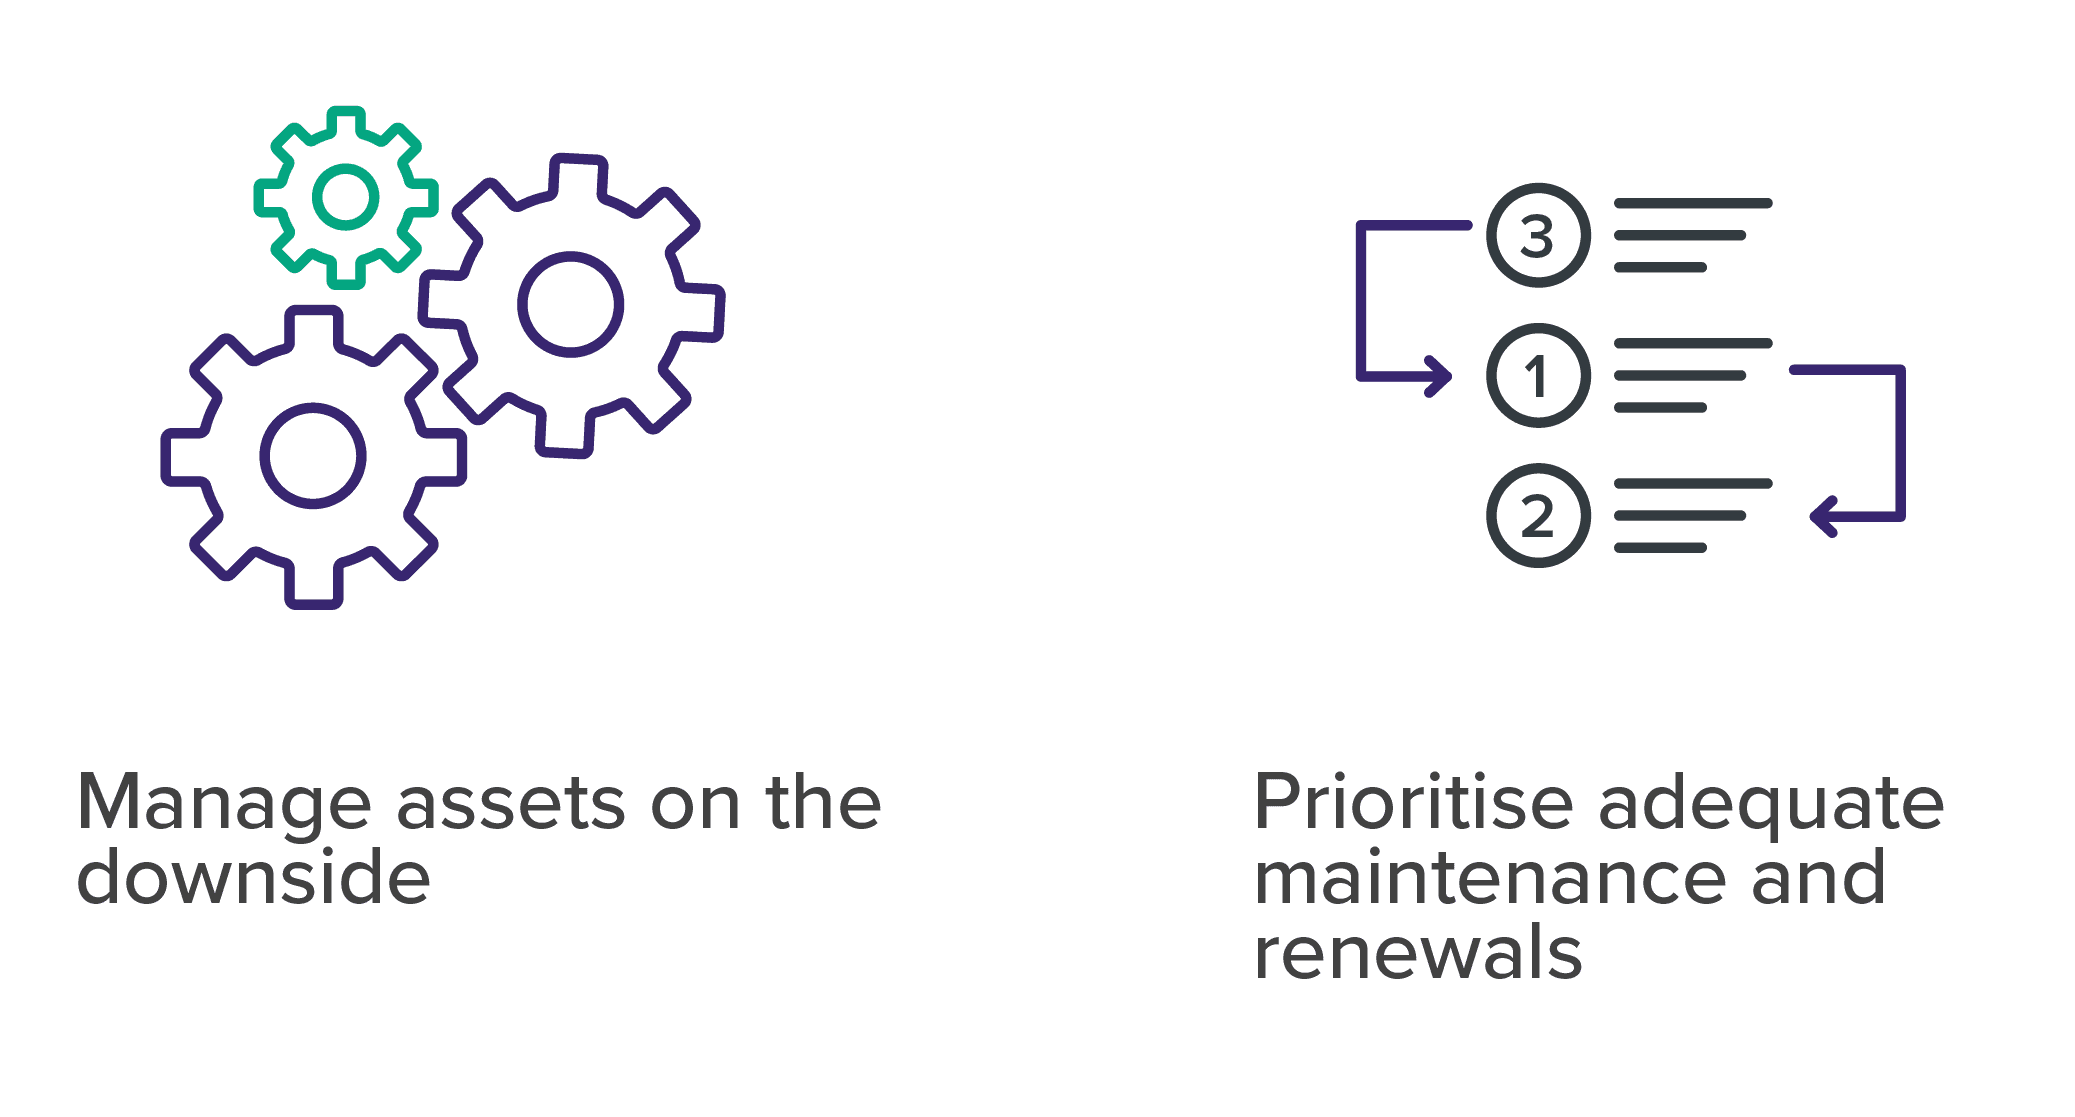
Looking after what we’ve got
-
Prioritising the right projects
-
Making it easier to build better
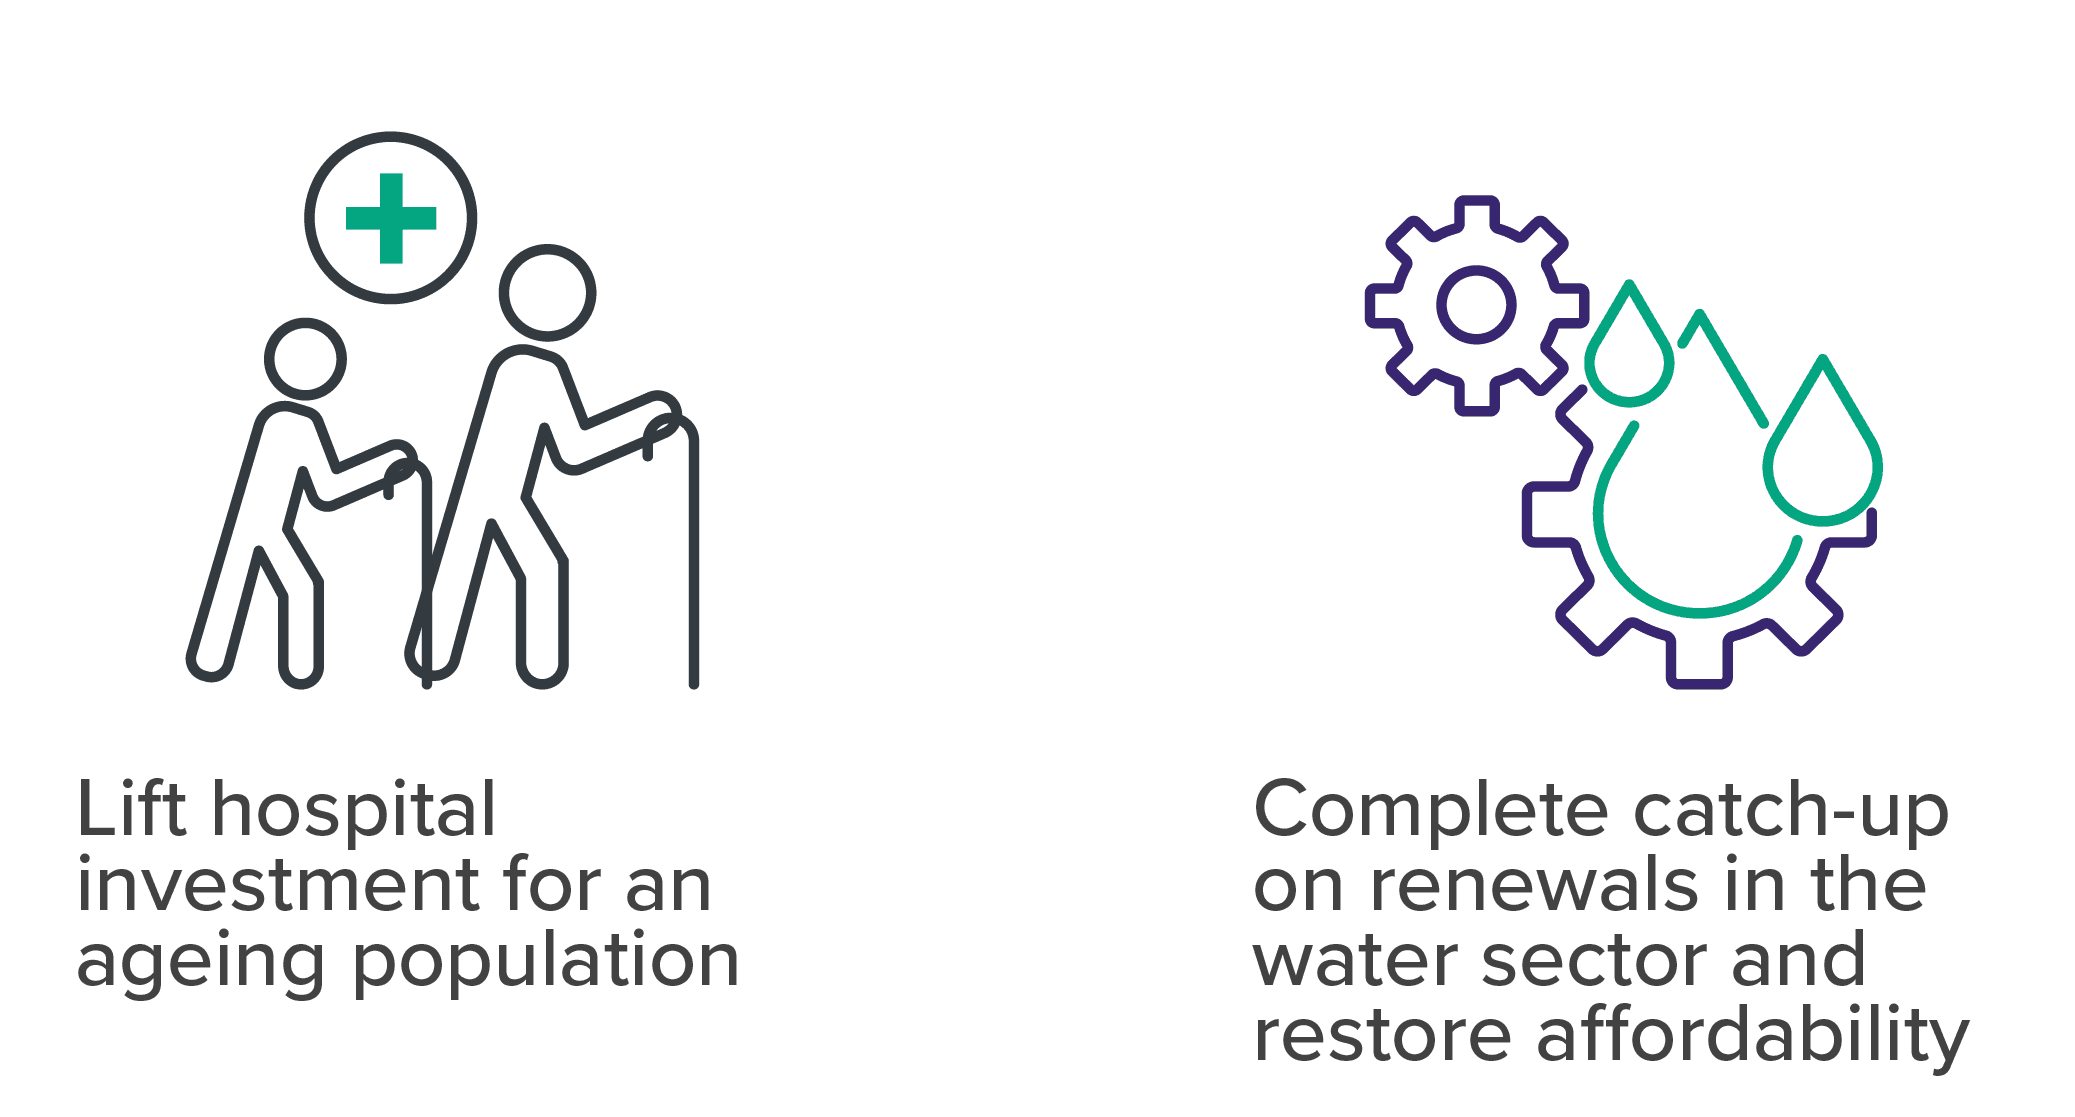
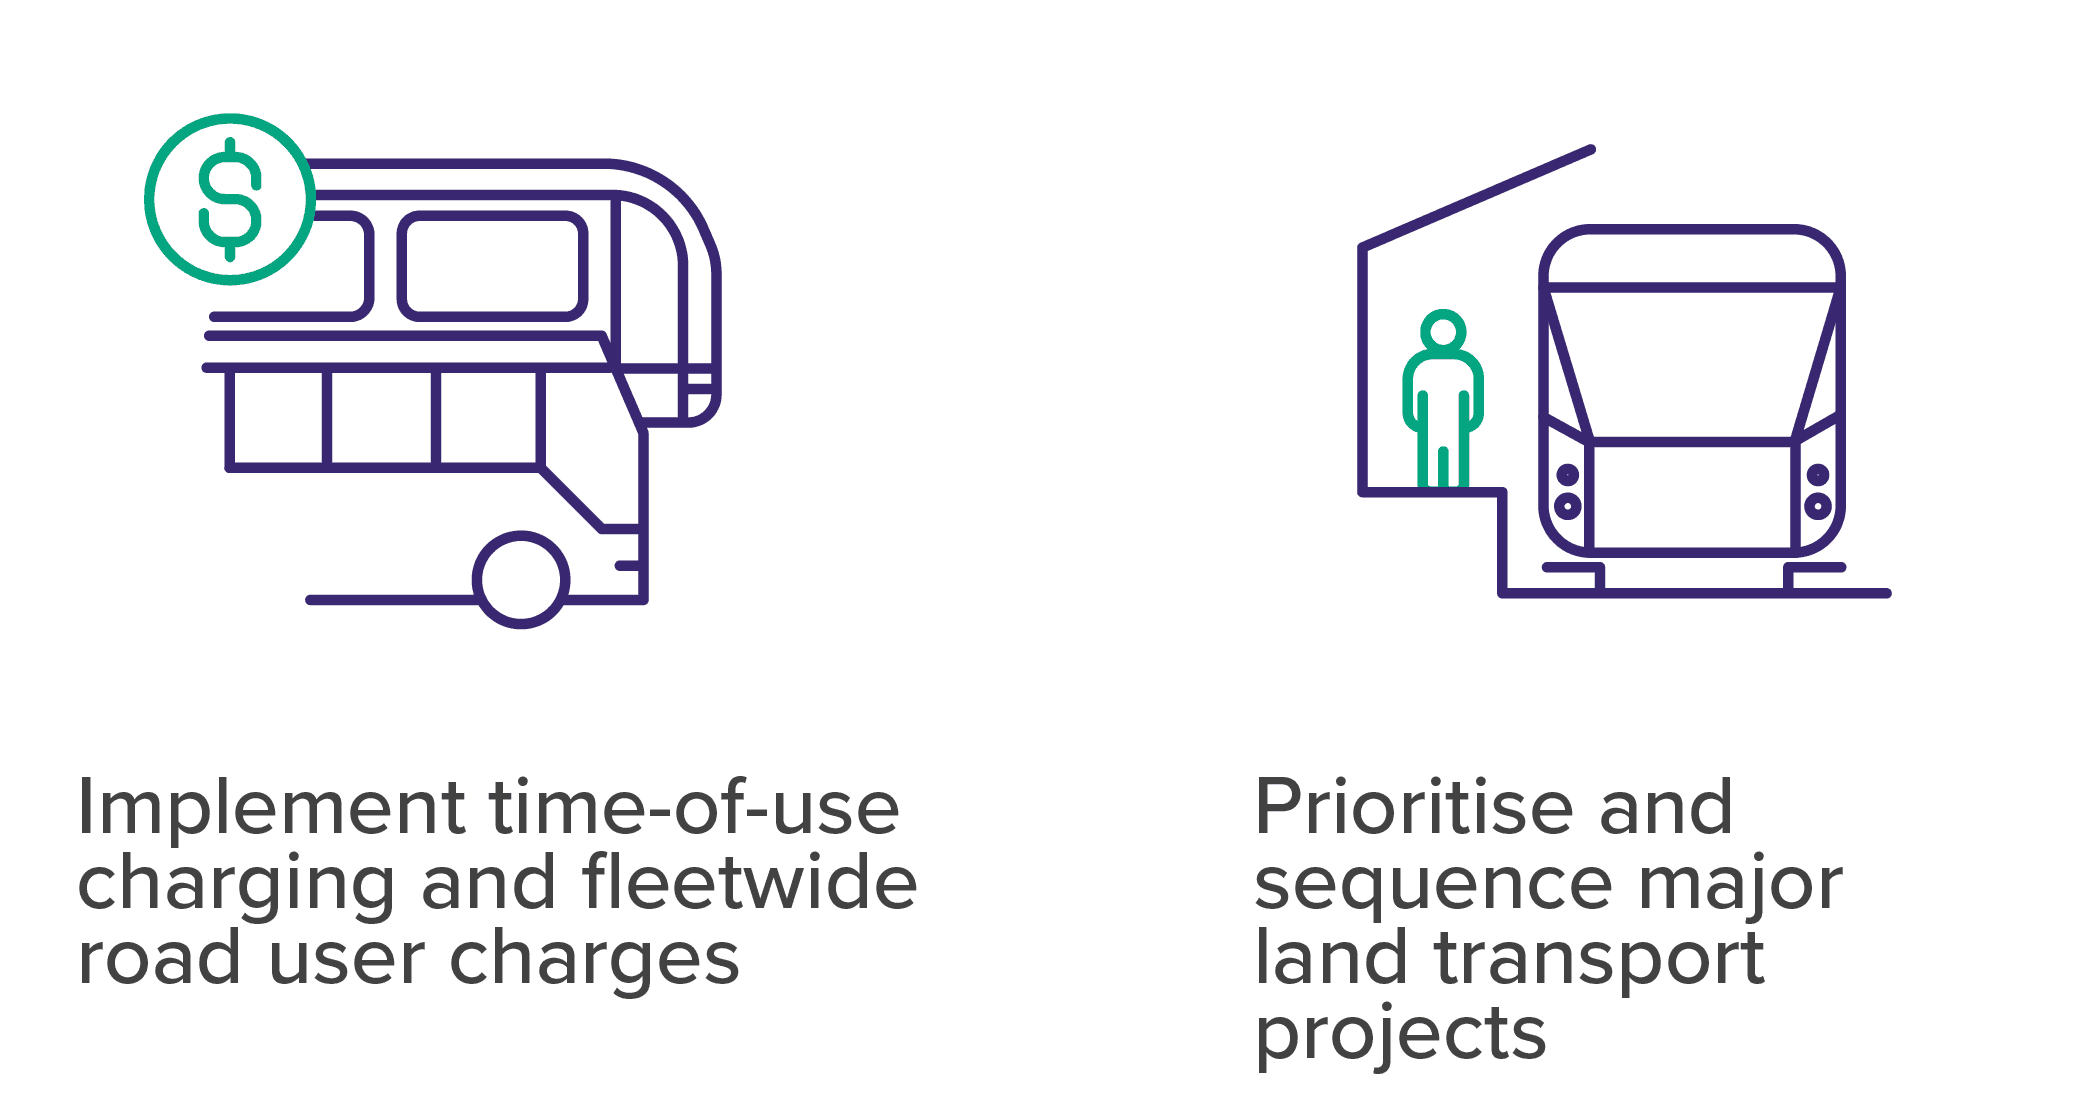
Some of the infrastructure issues we’re facing have been decades in the making – and they’ll take time to fix. But many of the issues require more urgent attention. We've highlighted 10 priorities that New Zealand needs to focus on over the next decade. These range from lifting hospital investment for an ageing population, to completing our catch-up on water infrastructure renewals across the country, to implementing time-of-use charging and road user charges to get the most out of our urban road networks.
10 priorities for the decade ahead

In this section
Read the Plan or find out more about how we developed it.
Read the Plan online
The National Infrastructure Plan sets out a practical, affordable pathway to deliver the infrastructure New Zealanders need to thrive over the next 30 years.
Download the Plan
The National Infrastructure Plan sets out a path to lift performance, improve value for money, and ensure infrastructure better meets the needs of New Zealanders over the next 30 years.
How we developed the Plan
The National Infrastructure Plans builds on the 2022 Infrastructure Strategy. We released a draft Plan last June and received more than 2,700 pieces of feedback to help inform the development of the final Plan.


Videos related to the National Infrastructure Plan


National Infrastructure Plan
The National Infrastructure Plan sets out a 30-year pathway for improving how New Zealand plans and delivers infrastructure.
Disclaimer
The National Infrastructure Plan responds to a statutory requirement.
Te Waihanga has taken reasonable care to ensure information in the publication is accurate and complete and that any opinions given are fair and reasonable. However, the use of information contained in this publication is at your own risk, and Te Waihanga is not responsible for any adverse consequences arising out of such use. We disclaim any express or implied warranties in relation to such information and opinions to the maximum extent permitted by law.
Any view, opinion, finding, conclusion or recommendation of an external party (including experts, researchers, parties providing feedback and surveyed respondents) is strictly that of the party expressing it. Its views do not necessarily reflect the views of Te Waihanga.
It is recommended that you seek appropriately qualified independent advice on any matter related to the use of this publication. If you enter into any transaction subsequent to reading this publication, you do so entirely in reliance on your own judgement and enquiries, and without reliance on any statements, warranties or representations made to you or to any other person by Te Waihanga or on our behalf.