Content
Content
Draft National Infrastructure Plan
3.3 The investment mix will change | Ka rerekē te āhua o te kanorau haumitanga
3.3.1 Context
Social, economic, and environmental trends have varying impacts on different infrastructure sectors and regions. New Zealand’s overall population will grow, requiring new infrastructure. However, some parts of New Zealand will experience declining populations. In areas with a declining population it will be harder to pay for and maintain existing infrastructure.
Our population will grow older, which will increase the relative demand for healthcare services and hospital infrastructure but reduce the relative demand for new schools and university buildings.
Our analysis translates national-level trends into estimates of investment demand for different infrastructure sectors. It can also be used to explore regional investment demands, although we have not completed this work for the draft Plan.
We provide ‘forward guidance’ on the future mix of infrastructure investment. This represent what is likely to be needed to meet demands at a sectoral level, relative to other investment needs and to what is likely to be affordable across all sectors.
3.3.2. Strategic direction
The investment mix adapts with changing needs
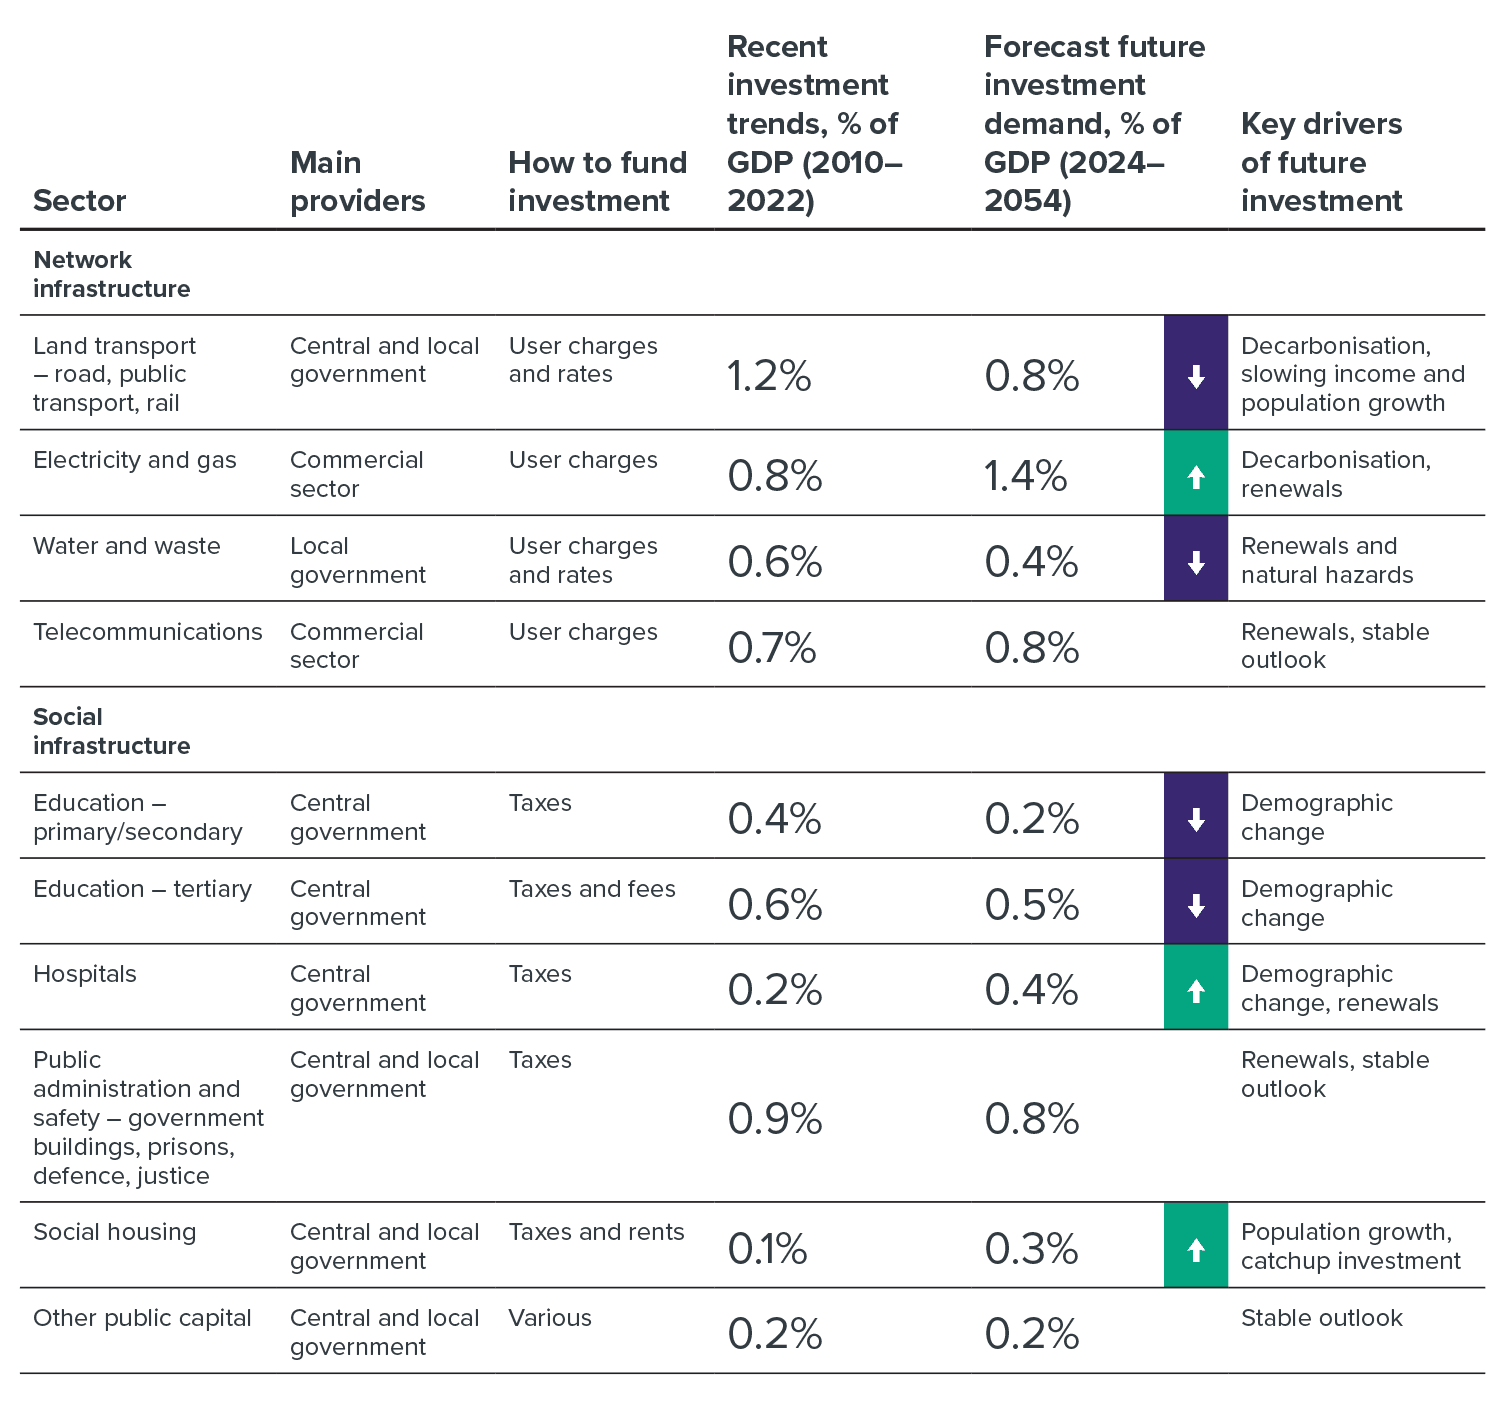
The mix of investment will change in the future. The long-term trends facing us will boost demand for some types of infrastructure and reduce it for others (Table 3). For example, an ageing population will reduce relative demand for education services, and the supporting school and university infrastructure, but increase the relative demand for healthcare services and supporting hospital infrastructure.
The ‘overs’ and ‘unders’ are likely to balance out. Some sectors will experience rising investment demand, as a share of GDP, while others will require a smaller share of GDP to be devoted to investment. This means that infrastructure investment as a whole will remain affordable, relative to the size of our economy, as long as we adjust to both increasing and declining investment demand.
Note on table 3: The infrastructure networks highlighted in our analysis are based upon those categories and definitions of infrastructure from our 2024 Research Insights paper, ‘Build or Maintain: New Zealand’s infrastructure asset value, investment, and depreciation, 1990–2022’. Those definitions are drawn from Stats NZ data from New Zealand’s national accounts. In some cases these categories do not neatly correspond to other, more detailed infrastructure sector classifications.
The mix of investment between and within sectors will change
Note: The infrastructure networks highlighted in our analysis are based upon those categories and definitions of infrastructure from our 2024 Research Insights paper, ‘Build or Maintain: New Zealand’s infrastructure asset value, investment, and depreciation, 1990–2022’. Those definitions are drawn from Stats NZ data from New Zealand’s national accounts. In some cases these categories do not neatly correspond to other, more detailed infrastructure sector classifications.
Table 3: Sector-level capital investment demand and key drivers
Investment rises in electricity and health infrastructure
We identify two sectors with a rising share of infrastructure investment.
· Electricity: We expect electricity infrastructure investment demand to increase due to technological changes and the need to decarbonise our economy. While this investment can be funded commercially from user charges, government policy will affect how much investment is demanded and how rapidly it can be supplied.
· Hospitals: We expect investment demand for hospital infrastructure to increase due to the need to renew and replace ageing hospitals and expand hospital services to serve the growing needs of an ageing population. While there are options about how to deliver additional hospital services, central government is expected to fund these through taxes. Hospitals are also seen as crucial in addressing health inequities between Māori and non-Māori, with Māori facing higher rates of chronic disease, injury and lower life expectancy.[36]
Investment eases in water, land transport and education
This will need to be balanced out by declining relative spend in three other sectors. Reducing the share of GDP we invest in these areas will help address the fiscal and affordability pressures facing an ageing population.
· Land transport: Investment in land transport (road, public transport, and rail) has been elevated over the past 20 years. This level of investment could moderate due to expected slowing of population and income growth, which play an important role in these sectors. Decarbonising our economy has implications for investment within land transport, reducing the need to invest in more roads while increasing it for public transport and active modes. This level of investment would mean we can continue to meet our needs with user charges, rather than requiring top-ups out of general tax revenues as has happened in recent years.
· Education: Overall, we expect investment demand for education infrastructure to moderate as the population ages. We note, however, that the Māori population is comparatively young, with an average age of 27.2 years, compared with the national average of 38.1 years, according to the 2023 Census. This means we may need to provide a different mix of services in the future.
· Water and waste: We expect water and waste investment requirements to moderate, following 25 years of ‘catch-up’ investment for assets that are ageing or in poor condition. Achieving this will require a focus on renewals.
Investment needs are monitored in sectors that are hard to forecast
Demand for justice and defence infrastructure is hard to predict. Due to policy and geopolitical factors, the demand for justice and defence infrastructure is difficult to analyse and forecast. For example, expected growth in prison populations, which influences the cost to build and maintain prison capacity, is affected by choices about justice and sentencing policies. Similarly, perceived defence infrastructure needs are influenced by broader geopolitical trends. Modelling investment demand is further complicated by the fact that historical capital investment data groups justice and defence infrastructure together, making it difficult to analyse past trends.
We are less certain about our forward guidance in these areas. This is an important area for future modelling improvements.
Investment responds to changing place-specific demands
Our forecasts focus on overall investment demands in each sector and the mix of factors that will drive investment. The spending ranges of our projections are sufficient to meet different demands over time, if projects and programmes are prioritised and delivered efficiently. However, the long-term trends will have different impacts on investment demands in different places, and for different communities.
Our initial results shed light on the types of impacts that we can expect. For example, population growth is faster in some regions than others. This is, resulting in more demand to build new infrastructure to service growth in faster-growing places, and a greater focus on maintaining and renewing existing infrastructure in slower-growing places. We expect that the modelling presented in the draft Plan could be improved to develop a deeper understanding of infrastructure investment demands at a regional level.
The infrastructure needs of Māori communities are different (Box 6). For instance, many marae are in hazard-prone locations, which can affect access to them. Our existing analysis can be used to start considering impacts, but further work is needed.
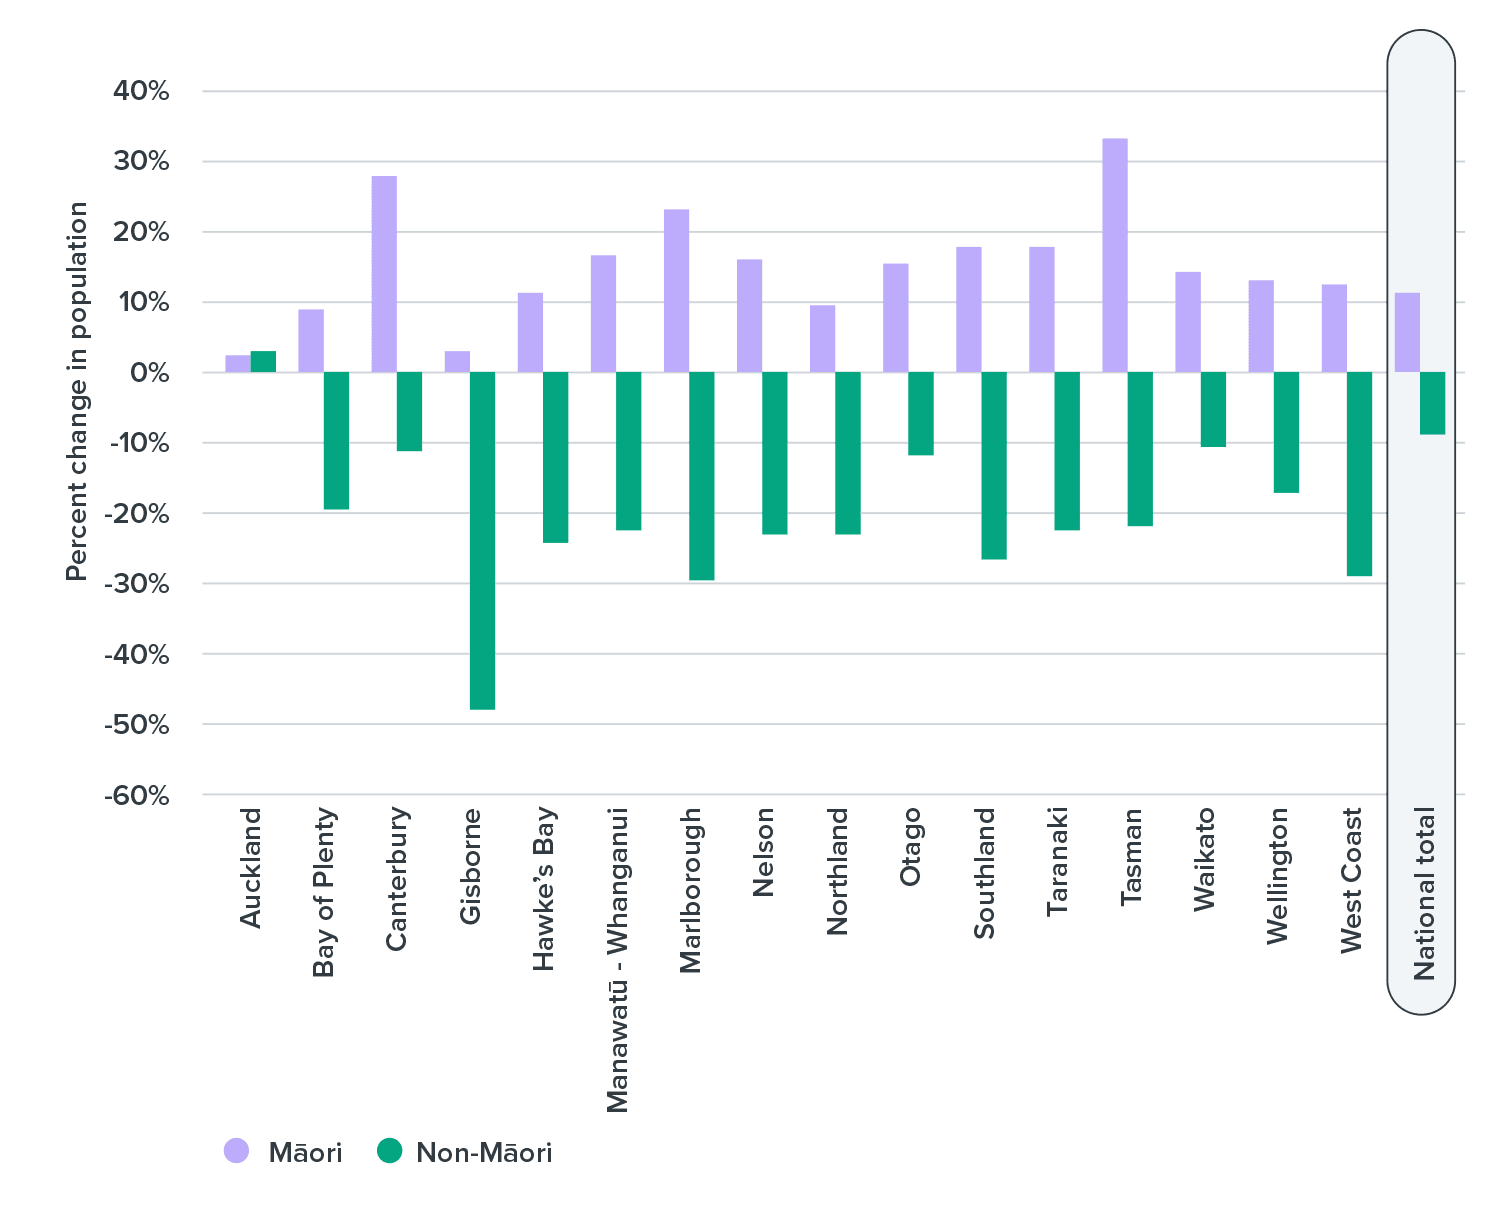
Note: Projected growth is from Stats NZ 2018–2043 population projections. Source: Analysing the Impact of Long-term Investment Drivers on Māori, Nicholson Consulting. Commissioned by the New Zealand Infrastructure Commission. (March 2025).
Figure 14: Projected population growth between 2013 and 2023, 5 to 19 years of age
Box 6
Drivers of demand we identify for future investment need may affect Māori populations differently
Certain infrastructure decisions may prevent the ability of Māori to exercise kaitiakitanga (guardianship) over te taiao (the natural world), or disrupt connections to their whenua (land), which are central to maintaining and enhancing Māori wellbeing.
While our forecasts present the overall picture of investment needs across sectors, we recognise that the story could be quite different for Māori populations.
A good example of this is the need for new or improved schools. Overall, the growth in the student-age population in New Zealand is expected to fall, which is reflected in our analysis as a subdued demand for future increases in investment beyond renewing existing schools.
This demographic dynamic is the opposite for Māori populations, which are expected to have significant growth in school-age populations (Figure 14). In addition to increased investment to meet expanding student rolls, this dynamic may also increase the availability of schools with Māori immersion settings.
Investment choices are sympathetic to household affordability
We have choices about how we fund and finance this investment. But regardless, New Zealanders will have to pay. Some costs will be met directly by households, through taxes, rates, or user charges. Others will be met by businesses and passed on to local or international customers. To understand whether our forward guidance is likely to be affordable for New Zealanders, the Commission has modelled household budget impacts based on scenarios for the mix of user charges and taxes typically used to pay for investment (Figure 15). This builds on our earlier research on household expenditure on infrastructure services.[37]
If implemented, our forward guidance would require households to pay more in charges or taxes in the near term (from now to 2035) but less in the long run. This arises from higher electricity charges to fund required investment for decarbonisation in the next 10 to 15 years. After this, lower investment requirements in education and land transport infrastructure mean overall spending on infrastructure will reduce the impact on household budgets. We also expect that rising charges to fund this investment will be offset by lower household expenses on goods such as petrol, which we do not model.[38]
Infrastructure investment has an impact on household budgets
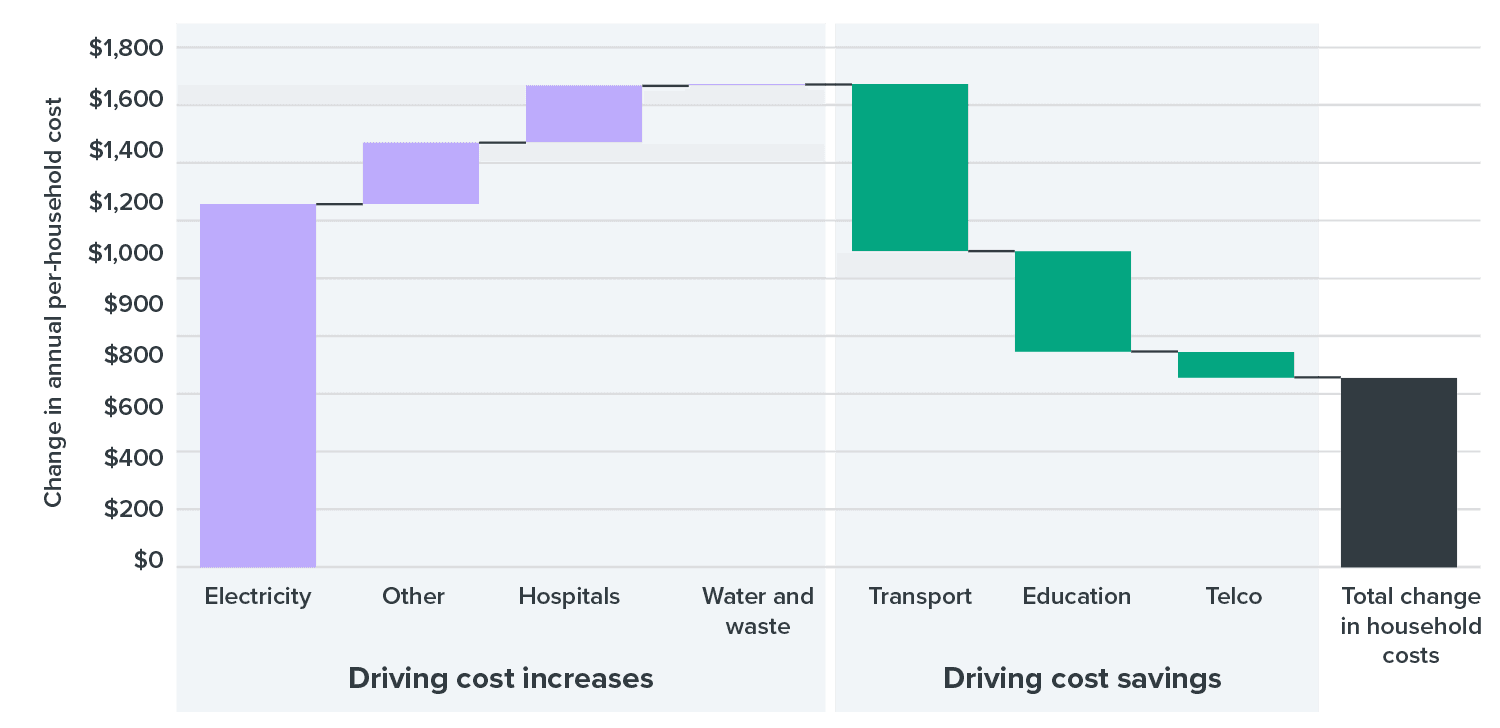
Note: Changes in cost are relative to expenditure on infrastructure services in 2019. Source: New Zealand Infrastructure Commission analysis and modelling.
Figure 15: What our forward guidance would mean for the average household budget, 2035–2040
The Commission expects the impacts to vary for different types of households over time (Figure 16). In general, higher income households use more electricity, spend more on transportation, and pay higher income taxes that fund social infrastructure, so in dollar terms, they will pay more towards future investment needs. However, as a share of household income, lower income households will pay modestly more, which is also the case for current expenditure on infrastructure services across household income groups.
Similar to today, lower income households will contribute a higher share of their income to meeting future infrastructure needs
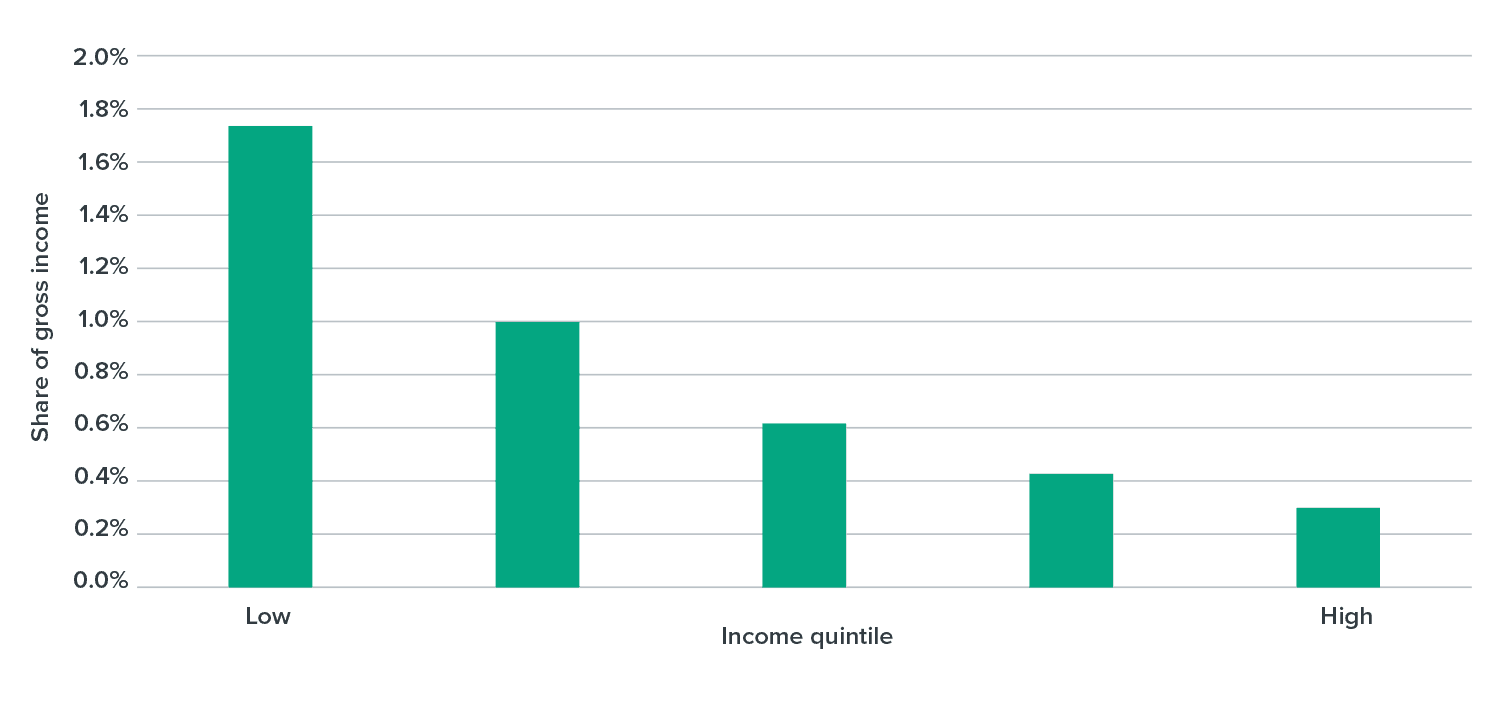
Note: We have used Stats NZ data for this figure. The income quintiles are formed by dividing the total population into five groups. The bottom quintile (quintile 1) is the lowest 20. Source: New Zealand Infrastructure Commission analysis and modelling % of the population in terms of income, while the top quintile (quintile 5) is the highest 20% of the population.
Figure 16: Impacts on the average New Zealand household budget of the Commission’s forward guidance, by household quintile group, 2035–2040