Content
Content
Draft National Infrastructure Plan
3.2. Investment must increase to meet future demands | Me piki te haumitanga e tutuki ai ngā popono anamata
3.2.1 Context
We forecast long-term demand for infrastructure investment for all infrastructure sectors and across all regions.[34] Our analysis focuses on capital investment in infrastructure, excluding operating expenditure related to infrastructure. It takes a long-term, national-level perspective, based on New Zealand's demonstrated willingness to pay for more or improved infrastructure, as opposed to bottom-up assessments of investment need based upon a defined set of outcomes. Our forward guidance on investment is designed to be affordable and sustainable over the long-term for many generations of New Zealanders. However, in some cases they may differ from bottom-up investment demand projections from infrastructure providers.
Our analysis considers the underlying drivers of investment demand. It accounts for the need to renew and replace existing infrastructure assets as they wear out and to address natural hazards that can damage infrastructure. It looks at the need to lift the capacity and quality of infrastructure in response to demographic changes, economic growth, and climate change. It also considers cases where less infrastructure may be needed in the future due to declining demand. To do so, we draw upon population and economic scenarios published by Stats NZ, the Treasury, and the Climate Change Commission.
We provide forward guidance on a sustainable path for future infrastructure investment. This represents what we believe to be an affordable path for New Zealand given what we have been prepared to spend on infrastructure in the past.
3.2.2. Strategic direction
Total infrastructure investment increases with population and economic growth
We expect demand for infrastructure investment to increase over the next three decades (Figure 11). To meet demand, annual capital investment would increase from around $20 billion today to slightly more than $30 billion by the 2050s (in 2023 NZD terms). This includes all types of infrastructure investment, regardless of ownership arrangements. We provide a sectoral breakdown below.
The balance of investment will shift. Rising investment demand reflects the need to renew, replace and build resilience into our existing infrastructure, as well as building new or improved infrastructure in response to demographic change, economic growth and decarbonisation needs. Renewal investment is expected to become relatively more important in the future, as the infrastructure we built in the past wears out and population growth slows.
Spending could be higher if New Zealand’s population and economy grow more rapidly. Spending could also be higher if we find investment opportunities that significantly increase the size of the economy or generate large increases in revenues that could fund more investment. This could happen if we experience significant technological changes or economic shifts that create the opportunity to build entirely new types of infrastructure, like the roll out of Ultra-Fast Broadband.
Infrastructure investment is expected to rise over the next 30 years
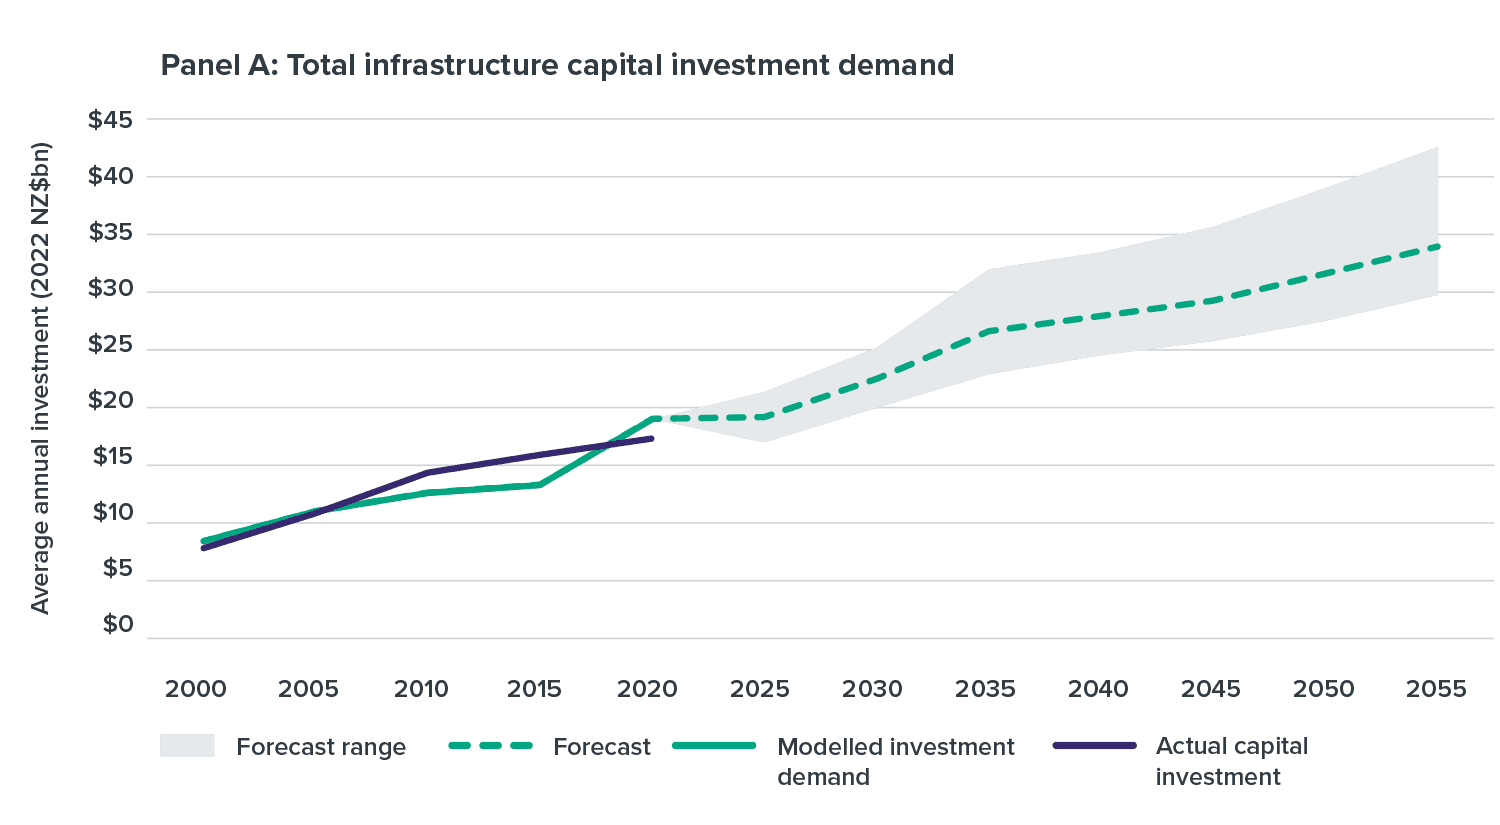
Note: These figures include capital investment but exclude operational spending on maintenance. .Source: ‘Draft Infrastructure Needs Analysis’. New Zealand Infrastructure Commission. (2025).
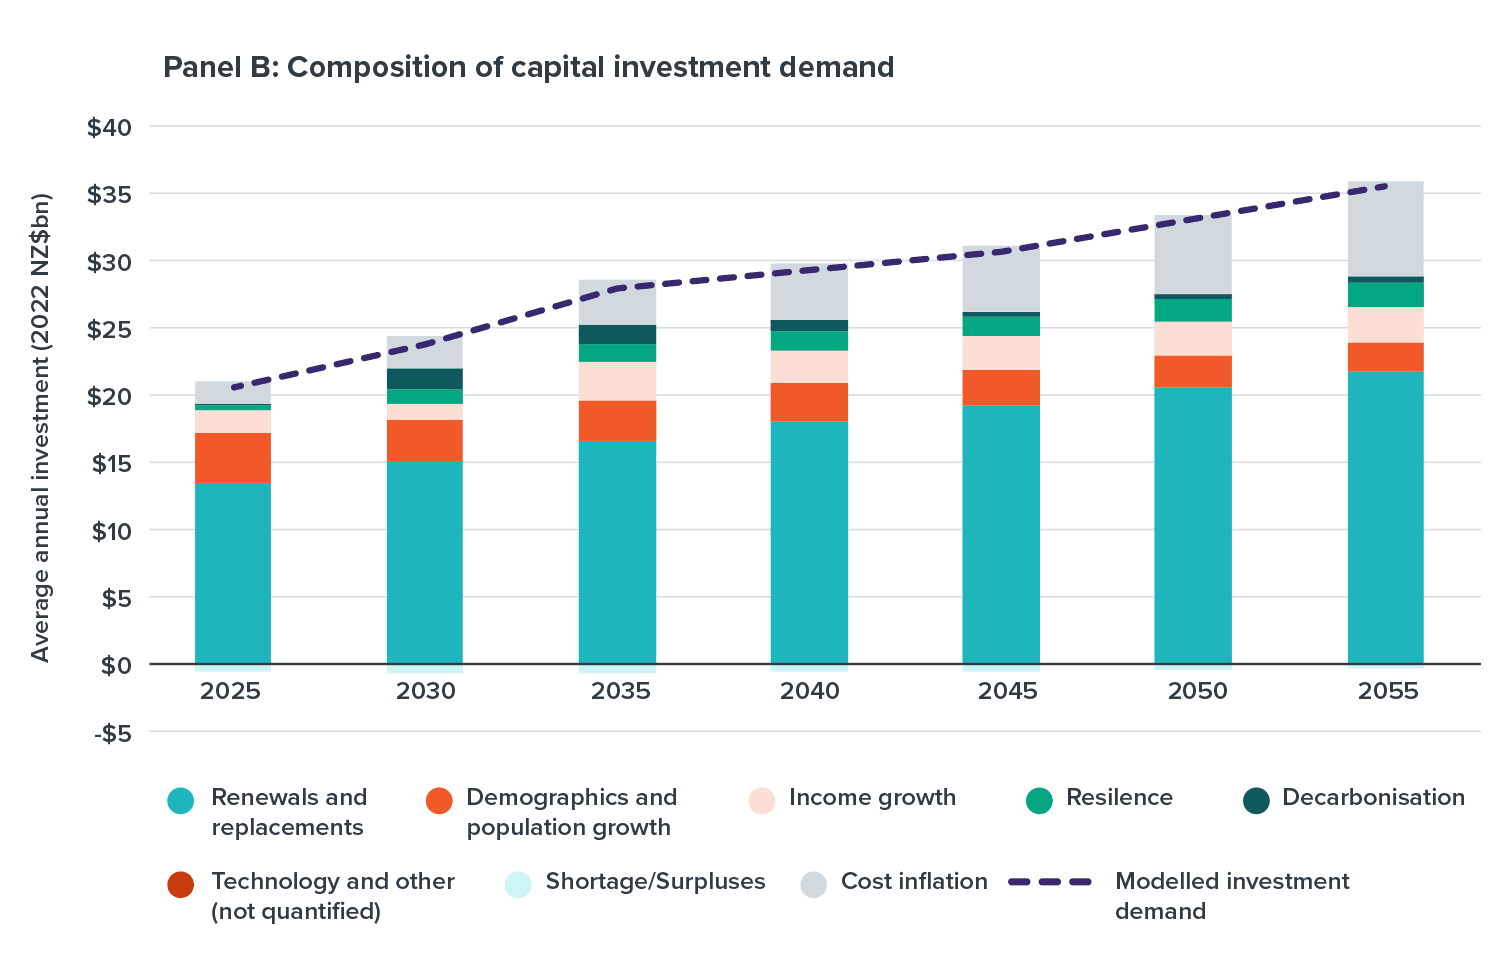
Panel B: Composition of capital investment demand. Note: These figures include capital investment but exclude operational spending on maintenance. .Source: ‘Draft Infrastructure Needs Analysis’. New Zealand Infrastructure Commission. (2025).
Figure 11: Historical and forecast demand for infrastructure investment, in 2023 NZD
A similar share of national income is allocated to infrastructure investment
While the total spend on infrastructure will increase, the ‘share of our wallet’ spent on investment is expected to remain constant. Our analysis indicates infrastructure investment will average around 5.8% of GDP over the next 30 years. This level of investment is similar to the share of GDP that we have spent in recent decades. Spending could be slightly higher or lower, depending upon what scenario happens. The Commission expects this to reasonably occur within the range of 5% to 7% of GDP (Figure 12X).
These levels of investment have been financially sustainable for past generations. Over the past 150 years, infrastructure investment in this country has averaged between 5% and 6% of GDP. We’ve had periods where we haven’t gotten the mix or level of investment right, where we’ve under- or over-invested relative to demand. However, we consider that this long-term trend represents a funding path that has been sustainable and affordable for New Zealanders in the past. As noted above, however, maintaining these levels of investment will pose a challenge given long-term fiscal and demographic trends.
Infrastructure spending is expected to be between 5% to 7% of GDP
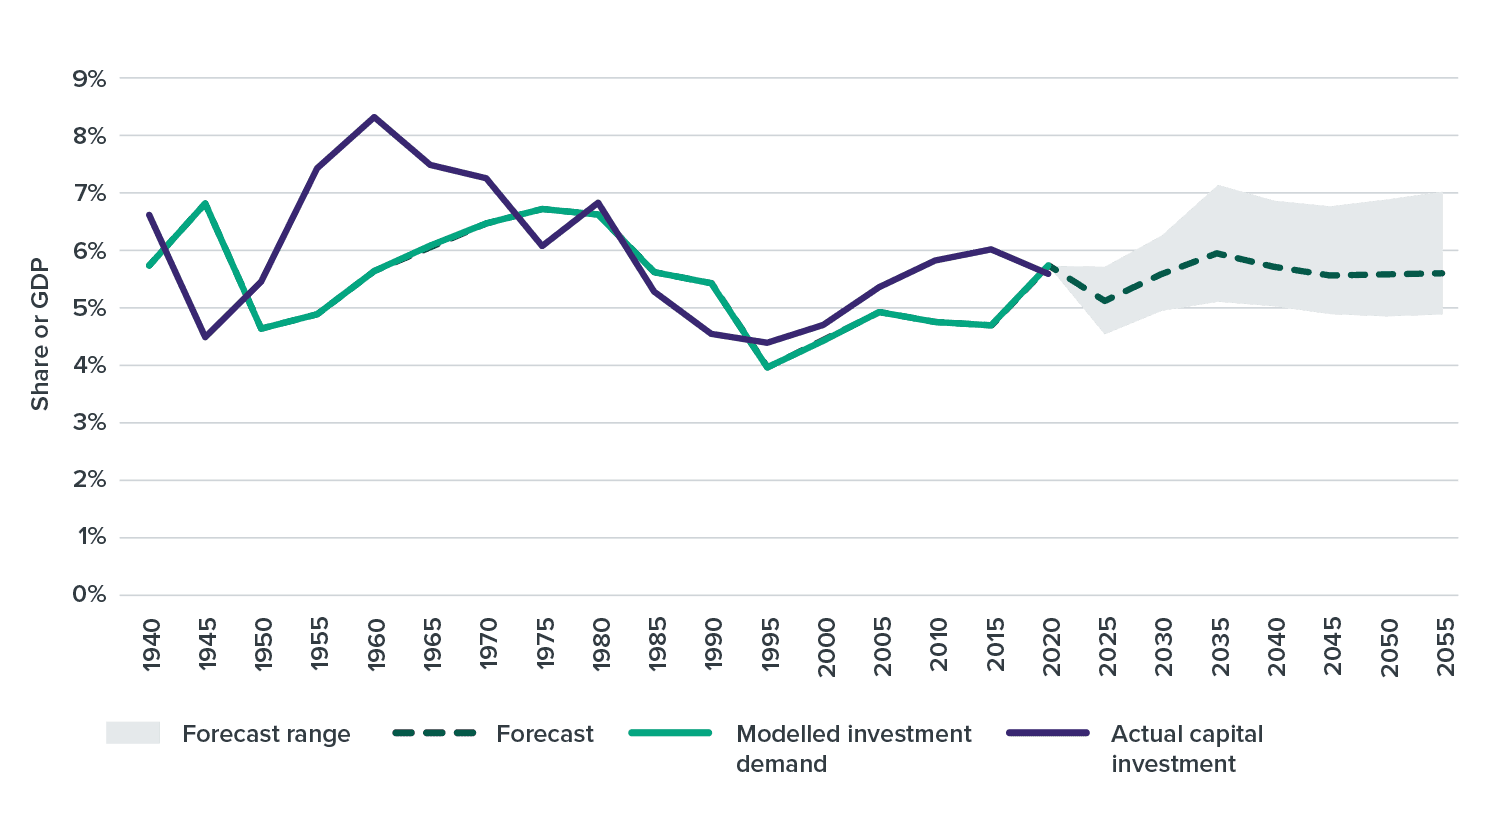
Source: ‘Draft Infrastructure Needs Analysis’. New Zealand Infrastructure Commission. (2025).
Figure 12: Historical and forecast demand for infrastructure investment, as a share of GDP
Investment increases with high-quality projects and the right funding tools
High-quality projects can unlock additional revenue streams to help pay for investment. This is because users are more likely to pay when new infrastructure offers them large benefits and when it can be delivered cost effectively.[35] Users’ appetite to pay more for better infrastructure can be tested through use of funding mechanisms like tolls for new roads and development levies for local government growth infrastructure.
When infrastructure offers transformational benefits people may be willing to pay much more. This is most likely to happen when major technological innovations come along. Examples include the development of electricity networks in the early 1900s (Box 5) and the rapid build-out of Ultra-Fast Broadband and mobile phone networks in recent decades.
Households and businesses also face limits on how much more they can pay through new charges. When new infrastructure offers incremental benefits relative to what’s already there, such as a second road link that slightly reduces travel times between two towns, households and businesses will not be able to afford to pay a lot more. However, looking for new revenue streams can still help us reduce fiscal pressures and help maintain investment levels over time.
Box 5
Electrifying New Zealand in the 1920s
People are willing to pay more for new infrastructure that delivers significant economic or quality-of-life benefits. In the early 1900s, electricity providers were supplying power in some New Zealand cities, but other cities, rural areas and regional centres did not yet have electricity.
The benefits of electricity were large and clear. At home, it meant shifting from candles, coal stoves and iceboxes to electric lights, electric ranges and refrigerators. For businesses, it meant more efficient and powerful machines to produce goods, lifting productivity and outputs.
The Electric Power Boards Act 1918 enabled local communities to band together to establish electricity power boards that could build power stations and electricity lines.
To finance the build-out of these distribution networks, local power boards issued loans that were then paid back by electricity users. By 1931, £12,821,666 worth of loans were issued, equal to $1.6 billion in 2024 dollars, or approximately $1,600 per resident.
Each of these loans needed to receive voter approval through a referendum. Although the cost of electrification was high for the average household, all power board referendums passed, with an average of over 85% support (Figure 13). This would be the equivalent of current Auckland residents voting overwhelmingly for a $4.5 billion piece of infrastructure, paid for solely by residents.
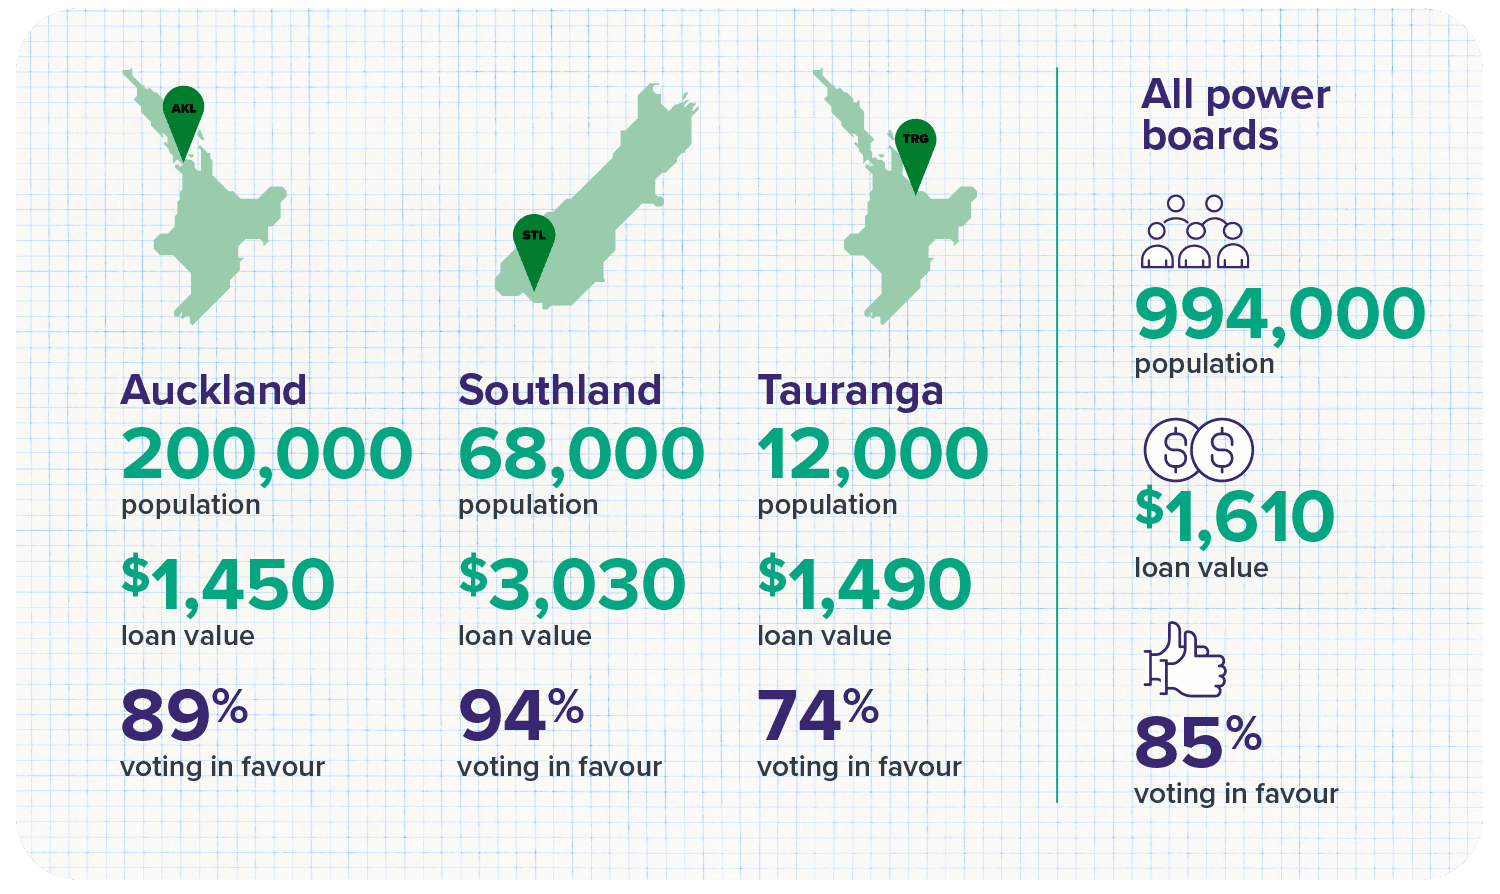
Source: Adapted from the New Zealand Official Yearbook. (1931).
Figure 13: Results of electricity power board referenda in selected areas, 1918 through 1931