Content
Content
Draft National Infrastructure Plan
7.5. Telecommunications | Ngā whitimamao
7.5.1. Institutional structure
Service delivery responsibilities
- The telecommunications sector includes fixed-line telecommunications services (both voice and data services, provided by fibre broadband and a legacy copper telecommunications network), mobile telecommunications services (both voice and data services) and other services like satellite broadband.
- Fixed-line broadband infrastructure is monopolistic, but there are many retailers of fibre broadband services to the household.
- A wholesale/retail structural separation applies to Chorus’s fibre broadband services and retail restrictions are placed on local fibre companies (LFCs). Other fixed-line broadband infrastructure, such as Hybrid Fibre Coaxial, is not subject to the same restrictions.
- Mobile services are competitive, with several firms offering services.
Governance and oversight
- The Commerce Commission regulates terms of access across a range of mobile, copper and fibre services, and collects information on service provision and pricing throughout the sector.
- Price regulation is restricted to fibre ‘anchor’ services (voice and broadband) and some legacy wholesale access pricing (copper and mobile termination rates).
- MBIE provides strategy and policy advice on communications markets and administers the telecommunication levies.
7.5.2. Paying for investment
- Telecommunications infrastructure is largely customer-funded. Overall costs of providing telecommunications services should be passed through to customers. However, central government has provided financing, and in some cases grant funding, for some infrastructure initiatives.
- Since 2010, the Government has invested around $2.6 billion in connectivity infrastructure, including $1.8 billion in loans to support the rollout of Ultra-Fast Broadband (UFB) and more than $770 million in grant funding for rural connectivity infrastructure in areas where services may not otherwise be commercially feasible to provide. It has also invested $1.4 billion in the Public Safety Network used by emergency services.
- Pricing arrangements include regulated revenue caps for monopoly segments of the market (set by the Commerce Commission), but other than this, providers have flexibility about pricing structures.
7.5.3. Historical investment drivers
- In recent decades, spending has been driven by the need to deploy new telecommunication technologies (mobile phones, internet) and respond to technology-driven increases in demand.
- Measured depreciation rates are high, reflecting the high rate of technological obsolescence in the sector. Legacy assets tend to be replaced with new technologies rather than renewed on a like-for-like basis.
7.5.4. Community perceptions and expectations
- In general, telecommunications services in New Zealand appear to be meeting New Zealanders’ expectations, especially in urban areas and where there is fibre connectivity. Rural areas still experience service challenges such as mobile black spots and broadband congestion. Satellite services are filling some of these gaps.
- Most New Zealanders rate the quality of services as good, and few see telecommunications infrastructure as an investment priority.
7.5.5. Current state of network
New Zealand’s difference from comparator country average
|
Network |
Investment |
Quantity of infrastructure |
Usage |
Quality |
|
Telecommunications |
+28% |
-12% |
+3% |
-4% |
Comparator countries: Columbia, Costa Rica, Chile, Canada, Finland, Sweden, Norway, Iceland. Similarity based on: Income, population density, terrain ruggedness, total population, urban population. Percentage differences from comparator country averages are based on a simple unweighted average of multiple measures for each outcome. Further information on these comparisons is available in a supporting technical report. [112]
- Over the past 10 years, New Zealand has spent a larger share of GDP on telecommunications infrastructure than most comparator countries.
- New Zealand’s fixed broadband network is comparable to our comparator countries in terms of network coverage, subscriptions, and quality (connection speeds).
- New Zealand’s uptake of mobile subscriptions is comparable to similar countries, and 4G mobile broadband coverage is similar to comparator countries, albeit at the lower end of the range. However, only 14% of population is covered by 5G mobile networks, which is nearly the lowest in the OECD and well below other comparator countries. New Zealanders also use a very low amount of mobile data compared to our peers, although mobile data usage is growing rapidly.
- The Commission also publishes performance dashboards that can be used to understand changes in the performance of New Zealand’s telecommunications sector over time. [113]
7.5.6. Forward guidance for capital investment demand
|
Telecommunications |
2025–2035 |
2035–2045 |
2045–2055 |
2010-2022 historical average |
|
Average annual spending 2023 NZD) |
$3.3 billion |
$4.0 billion |
$4.7 billion |
$2.1 billion |
|
Percent of GDP |
0.8% |
0.8% |
0.8% |
0.7% |
This table provides further detail on forward guidance summarised in Section 3. Further information on this analysis and the underlying modelling assumptions is provided in a supporting technical report.[114] Our analysis for the telecommunication sector includes investment in all fixed assets to service the sector. This includes assets such as fibre cables and towers but also includes data processing and storage facilities. Underlying data is drawn from Statistics New Zealand National Accounts data on asset values.
- The telecommunications sector is characterised by technological innovations leading to rapid deployments of new networks and retirements of existing technologies. This rapid technological progress makes forecasting investment demand challenging.
- Innovations in artificial intelligence and mobile phone technologies suggest that technology will continue to drive elevated investment in the sector.
- The sector has been in an investment boom since the 1980s, although peak levels of investment occurred in the 1990s and early 2000s. High depreciation rates in telecommunications suggests that renewal or replacement of the existing network will continue to drive investment after this period of high investment.
7.5.7. Current investment intentions
- The Pipeline’s information on the telecommunications investment underrepresents the investment occurring in the sector. Private sector providers are encouraged to contribute information on their initiatives in planning and delivery. Based upon information from Statistics New Zealand, this figure could be between $2 and $3 billion per year.
- The following chart shows that projected spending to deliver initiatives in planning and delivery in the Pipeline (blue bars) are significantly below than the Commission’s investment demand outlook (black lines) over the 2025–2035 period. This is due to limited contributions by the commercial entities responsible for telecommunications investment.
- The Commission’s investment outlook, which is based upon Statistics New Zealand capital investment data, suggests slowly rising investment demand.
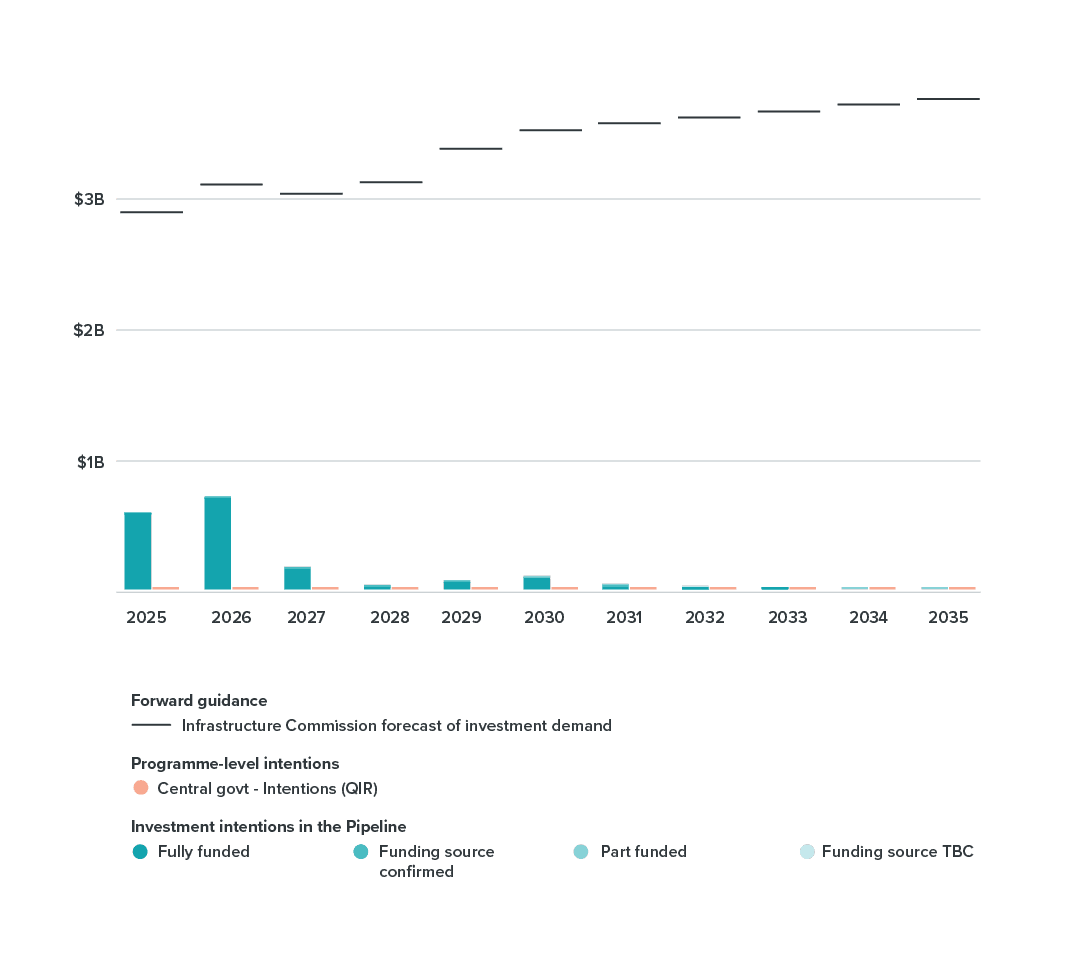
This chart compares two different measures of future investment intentions with the Commission’s forward guidance on investment demand. The blue bars show projectlevel investment intentions from the National Infrastructure Plan. The orange bars show the small amount of investment intentions in central government’s reporting to the Treasury’s Investment Management System. The black lines show the Commission’s forward guidance on investment demand.
7.5.8. Key issues and opportunities
- Rural telecommunications access: 13% of homes are not connected to fibre broadband. With the eventual withdrawal of Chorus’ rural copper network, a mix of fibre, wireless, and satellite technologies will be needed to provide modern telecommunications services to customers not currently served by the fibre network.
- Governance and regulation: OECD surveys into regulation in the sector have highlighted potential gaps related to competition in the sector, scope of regulation (only Chorus is price/quality regulated, while LFCs are subject to information disclosure), and the potential for government decisions to directly impact the Commerce Commission.
- Transparency and information: There are some publicly available or centralised sources of information on the condition of telecommunications assets. Chorus and LFCs produce reasonably thorough asset age and health information (although short of full asset management plans like electricity and gas) and these are public. Mobile and other network assets are more unknown. There is also comparatively little research on the vulnerability of New Zealand’s telecommunication assets to natural hazard risk.