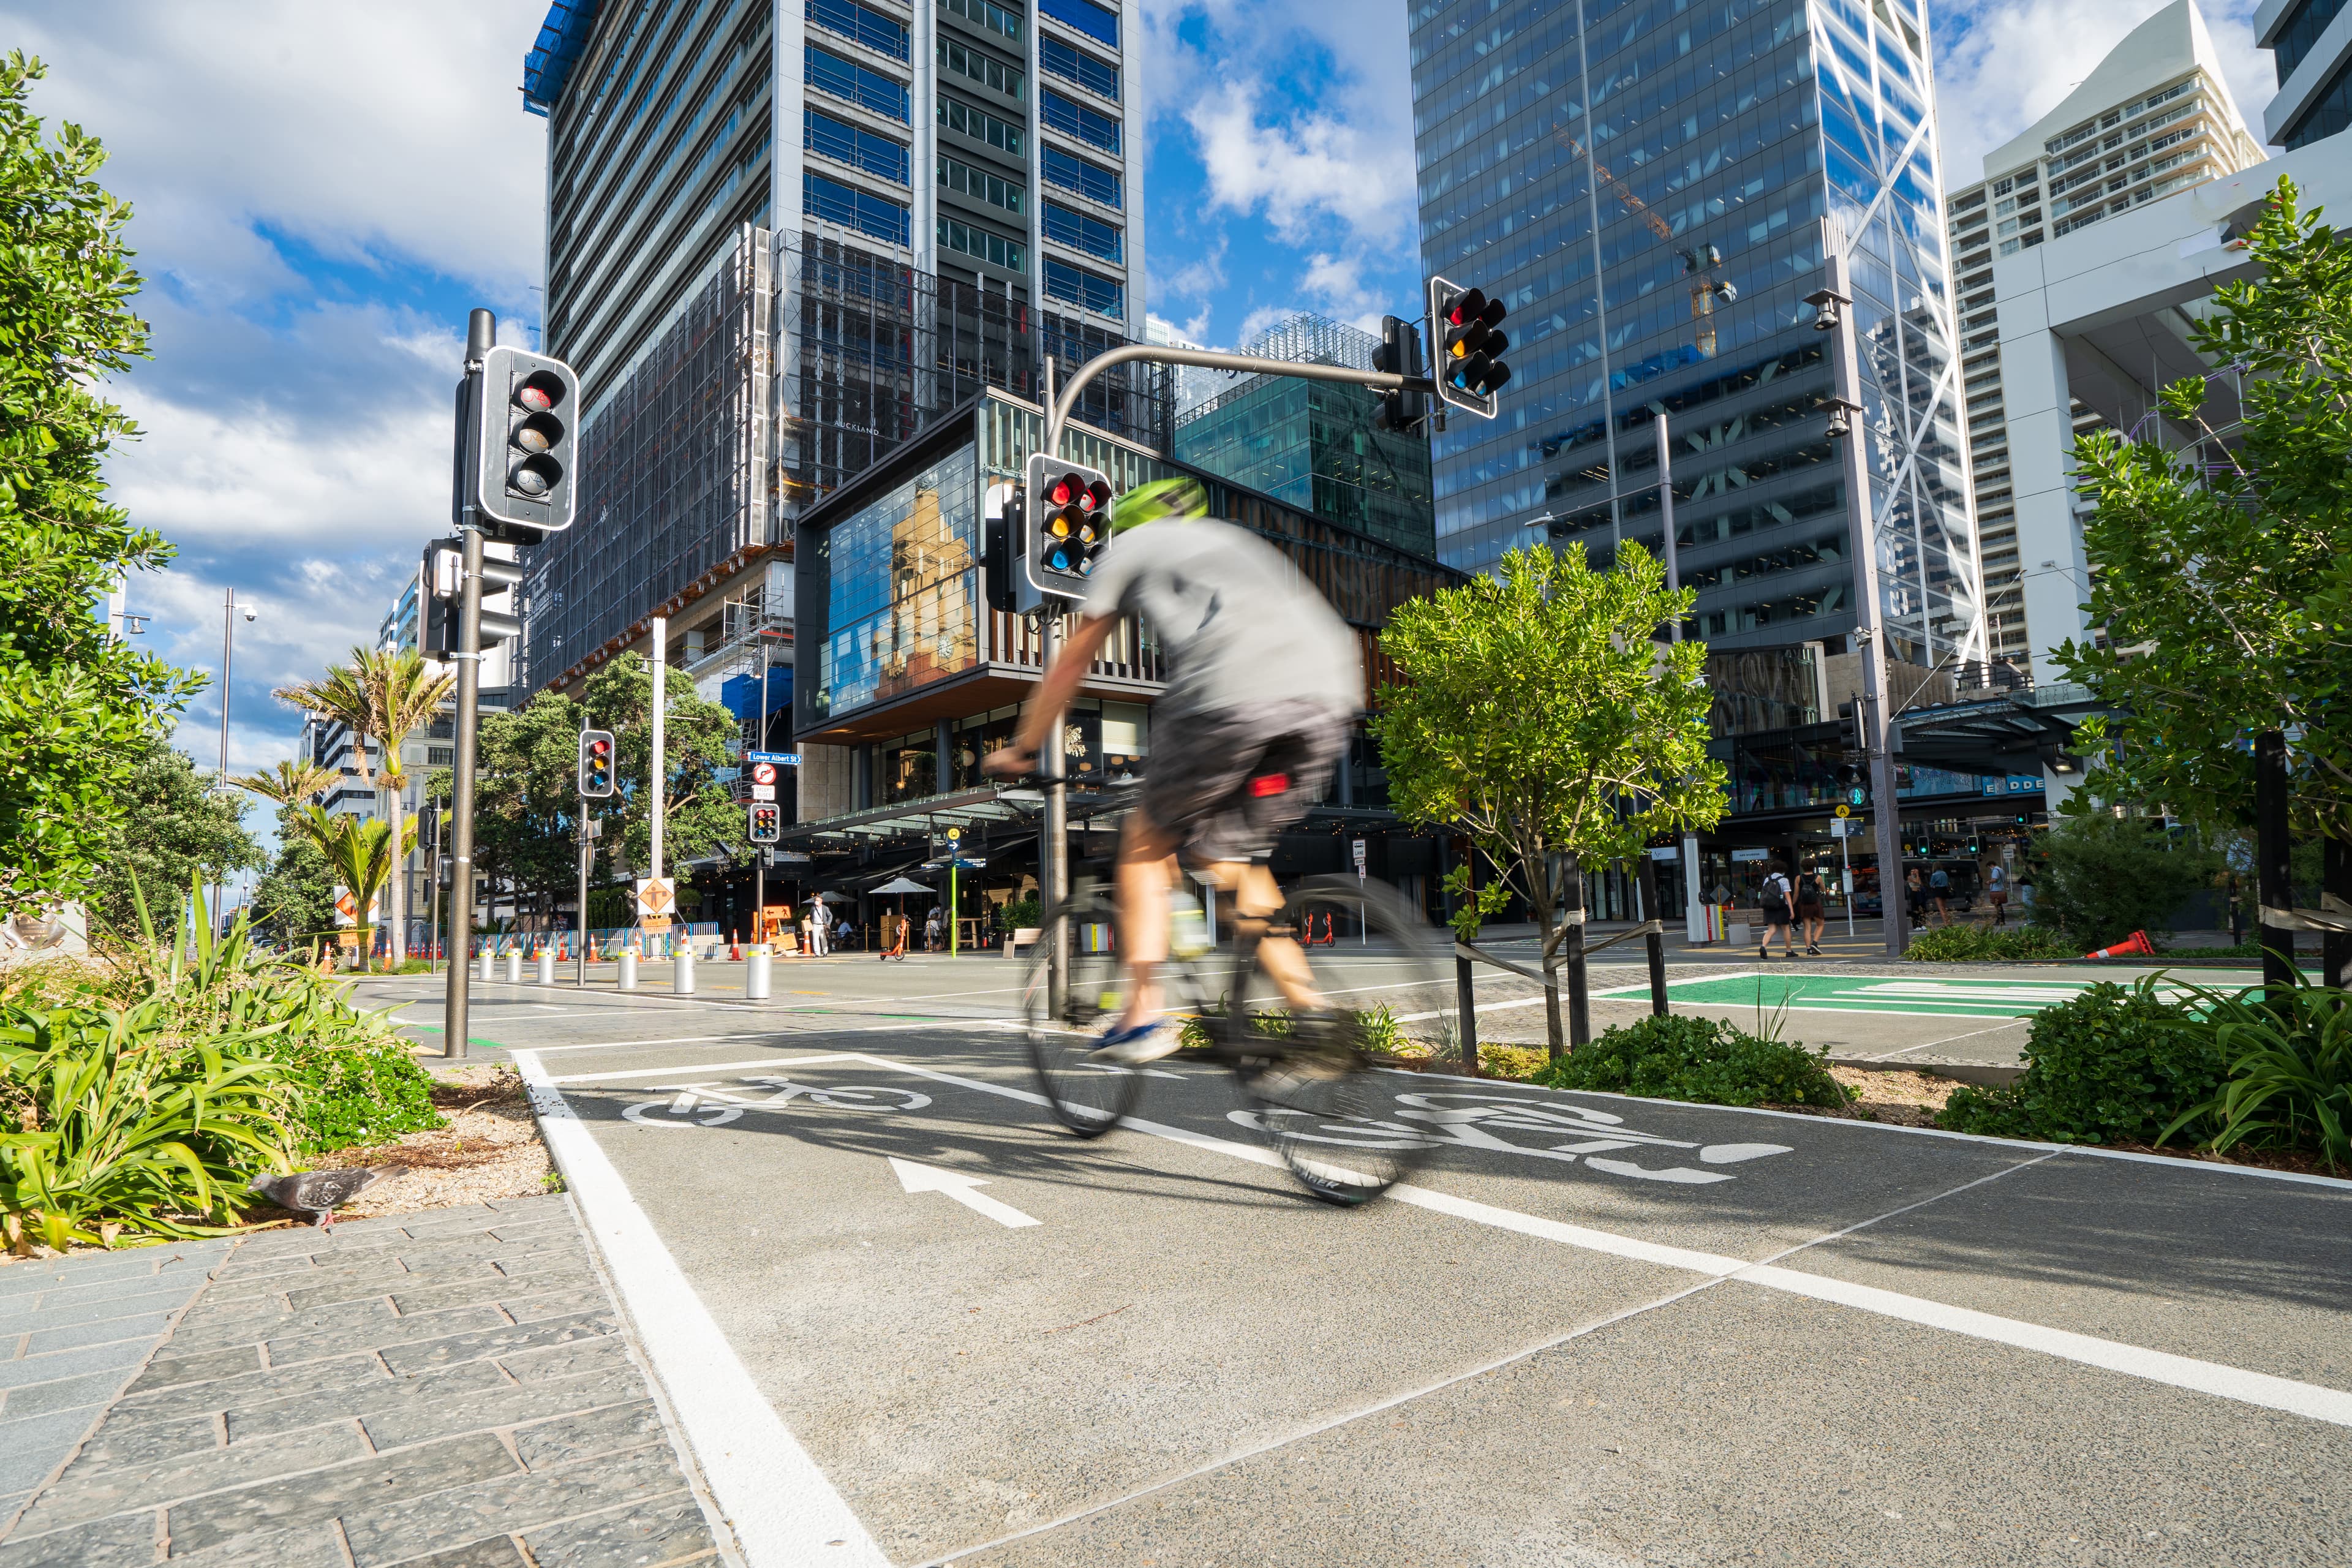

Auckland is New Zealand’s largest city and only city with a population over one million. In 2023, the Auckland region had a population of 1.66 million people, or 33% of New Zealand’s total population, and it contributed 38% of the country’s total economic output (GDP, or gross domestic product). However, the Auckland region only occupies 1.8% of the country’s total land area.
Auckland faces different infrastructure challenges than other parts of New Zealand, due to its size, density, and growth rate. City size and density affect how much infrastructure is needed in total, what it costs to service people with infrastructure, and what types of infrastructure are needed.
Based on our previous research, we identify three ways that Auckland is different to the rest of New Zealand when it comes to infrastructure.
Key findings
- Auckland is cheaper to service with network infrastructure – but new projects can be more expensive. Auckland benefits from economies of density in infrastructure network provision, however, the cost to build new infrastructure may be higher in Auckland, due to more complex mitigation requirements and higher land prices in built-up areas.
- Aucklanders spend a smaller share of their income on infrastructure services. On average, Auckland households spend a smaller share of their after-tax income on infrastructure services than non-Auckland households, but because incomes are higher in Auckland they spend more in dollar terms.
- Aucklanders have slightly different views about the fairness of some options for pricing infrastructure. Aucklanders are more likely to think that it was fair to price piped water based on what it costs to supply to households or based on how much water households use, and more likely to think that it is fair to price roads based on how much people drive or based on whether they are travelling at peak times.
Auckland’s infrastructure: The cost to serve a city that’s growing upwards
Published on 17 January 2025