Content
Content
Draft National Infrastructure Plan
1.2 New Zealand spends a lot but doesn’t always get value | He nui ngā whakapaunga a Aotearoa engari kāore e tino kitea te wāriu
1.2.1. We’re willing to pay for infrastructure
Infrastructure is not free – someone has to pay. Providing infrastructure means paying upfront costs to build assets. It also means paying ongoing costs to maintain, renew, replace and occasionally decommission infrastructure assets. We can fund infrastructure through user charges, local government rates, or central government taxes. We can also borrow to pay for upfront costs and repay the loans over time. But one way or another, the cost of providing infrastructure is borne by New Zealanders.
New Zealand spends more than most on infrastructure. Over the last 20 years New Zealand’s average spend on infrastructure is 5.8% of gross domestic product (GDP).[17] Crown investment as a share of GDP accounts for about 40% of this, or 2.5% of GDP. More recently, between 2010 and 2019, New Zealand spent more per capita than any other OECD country on infrastructure (Figure 3). As a country, New Zealand has demonstrated a willingness to spend on infrastructure.
1.2.2. ‘Bang for buck’ is a significant challenge for New Zealand
We don’t get enough for our infrastructure dollar. The quality of our infrastructure lags, relative to what we spend on it. High-level comparisons suggest that New Zealand has among the lowest infrastructure spending ‘bang for buck’ in the OECD (Figure 3).
New Zealand has difficult terrain and a small population spread over a large land area. New Zealand has a similar population to Greater Sydney, New South Wales. But our 5.2 million people are spread over 21 times as much area as Sydney’s 5.3 million.[18] We can’t always afford to build infrastructure to the same standard as more densely populated countries, because we don’t have as many people to use and pay for it.
But we also make things difficult for ourselves. It is costly to build complex public infrastructure projects in New Zealand, relative to other high-income countries.[19] We sometimes make hasty decisions about projects, leading to cost overruns. We also make it difficult to make best use of existing assets. For instance, the lack of congestion charging means we frequently build urban transport networks for the peak; rigid land-use planning rules prohibit making better use of rapid transit lines; and the absence of water metering often means we cannot proactively target maintenance programmes at leaking pipes (Box 4).
Box 4
What we heard – regulatory and institutional frameworks
Regulatory inefficiencies, complex approval processes, and inconsistent frameworks were highlighted as the main factors delaying infrastructure projects and driving up costs by many respondents in feedback to ‘Testing our thinking’.
Many advocated for a more strategic, coordinated approach to infrastructure planning across government agencies, local councils and industry stakeholders to reduce duplication and ensure better alignment between policy, funding, and project delivery.
New Zealand spent more on public infrastructure than any other OECD country in the 2010s, but the quality of our infrastructure doesn’t measure up to what we spend
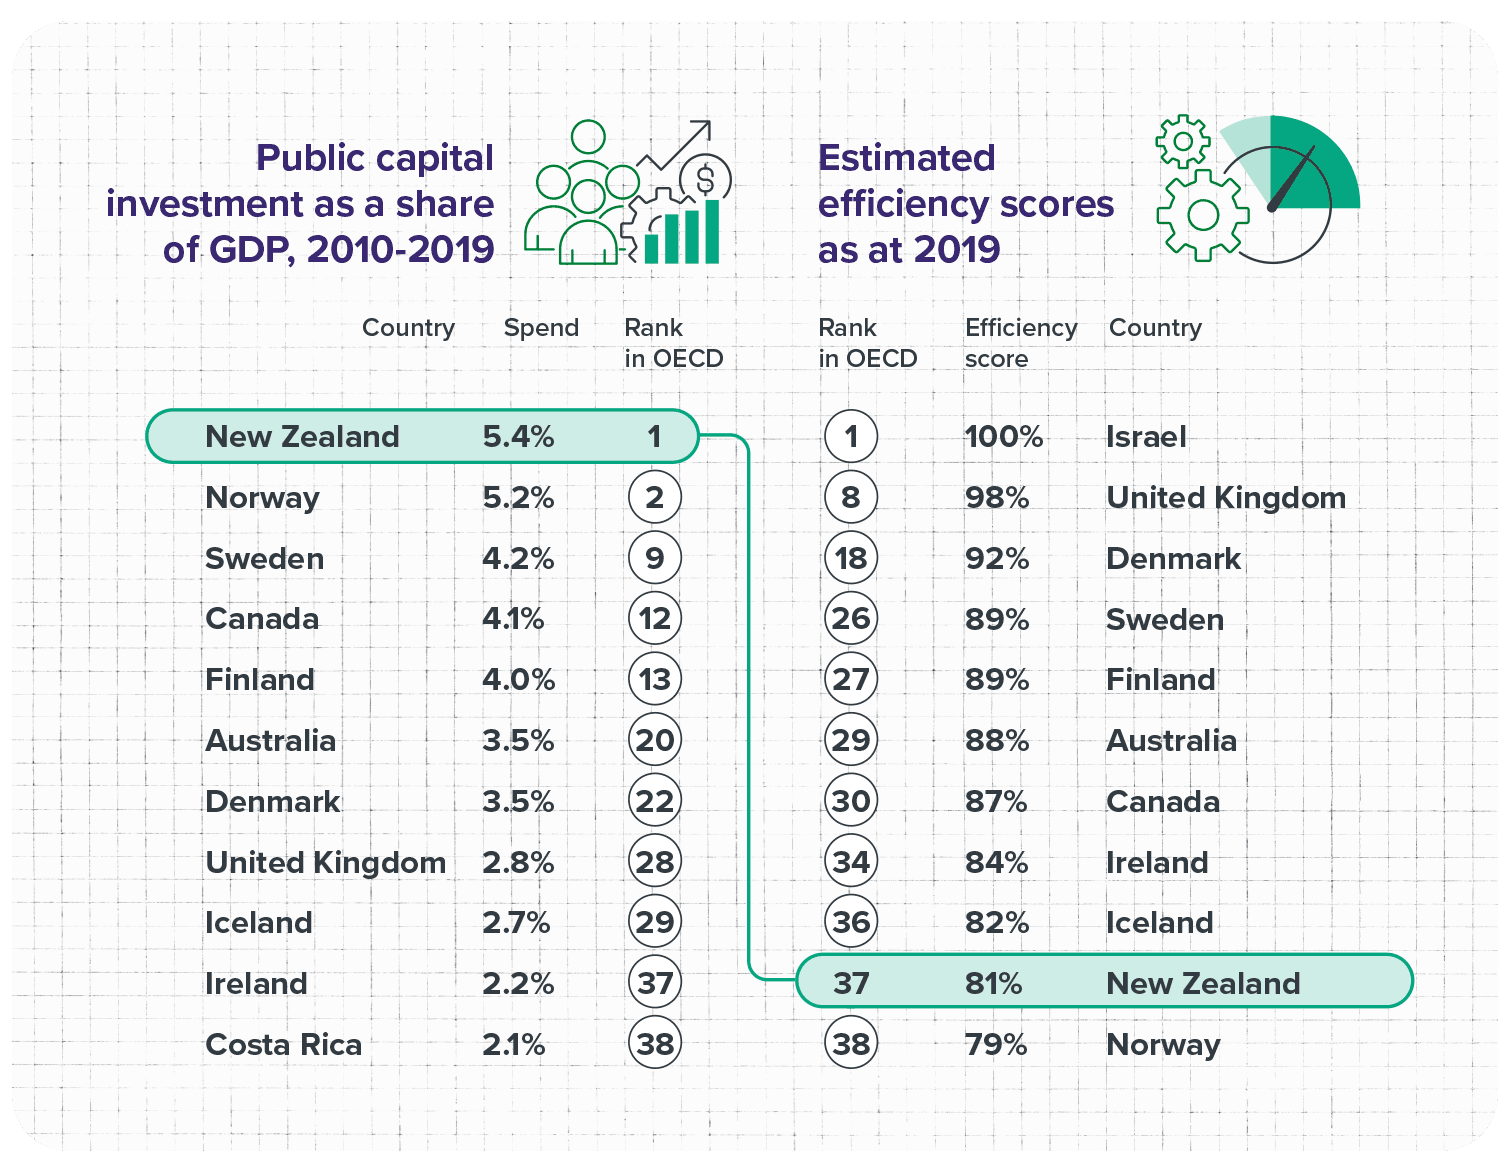
Source: Adapted from ‘Investment gap or efficiency gap? Benchmarking New Zealand’s investment in infrastructure’. New Zealand Infrastructure Commission. (2021). Note: “Public capital investment” refers to investment by central government and subnational governments, including some non-infrastructure investment, but excludes investment by private infrastructure providers.
Figure 3: Public capital investment and investment efficiency scores for selected OECD countries
1.2.3. We need to lift our game to meet our needs
New Zealand needs an infrastructure investment approach that is affordable and that delivers the right services in the right places when they are needed. We need to fund projects with long-term value to users, including the maintenance and renewal of existing assets. Getting these things right means investment will contribute to maximising overall economic, social and environmental prosperity. However, there are significant challenges to achieving this that are unique to infrastructure.
Many things need to go right to ensure we get the best value from what we are spending. We need to understand users’ needs and understand our existing infrastructure and what’s needed to keep it working.[20] We need to plan ahead, accounting for the needs of current and future generations. [21] We need project leaders who can successfully plan and design projects. We need to be able to protect land for future infrastructure projects [22] and consent infrastructure projects through resource management legislation.[23] We need a capable and right-sized infrastructure workforce,[24] and clients and construction firms that can work together to drive productivity.[25] We need pricing that optimises how we build and use infrastructure.[26]
A consistent approach to investment is important, even if the projects change over time. Infrastructure policy and investment have experienced notable change in recent electoral cycles. A ‘stop-start’ approach can be costly for ongoing investment programmes and large projects with long planning and delivery timeframes. We need an approach to investment that provides more certainty that projects are solving the right problems, that they’re affordable and can be delivered.
Infrastructure lasts for generations. We need to make choices that will stand the test of time. Getting it right means leaving a positive legacy for future generations, infrastructure that people want to keep using and maintaining for their children and grandchildren. Getting it wrong can mean leaving behind projects that were built in the wrong place or at the wrong time and the burden of paying off debt for infrastructure that’s not being used.
1.2.4. An ageing population and poor productivity mean money’s getting tighter
Economic and demographic changes will make it harder to pay for investment in the future. At the same time as we’re facing rising costs to build and maintain infrastructure, economic growth is predicted to slow down.
New Zealand has an ageing population. In 1960, New Zealand had seven working-age people for every one person over the age of 65. Today, this ratio is around four to one. By the 2070s the ratio will have fallen to two working-age people for every one over the age of 65 (Figure 4). The age group that is the largest recipient of government benefits is the fastest-growing group, while the working - age population will shrink without immigration from the early 2030s. And as a share of the total population, the working - age population will start shrinking now.[27]
Productivity growth is slowing. Productivity growth means that the amount of goods and services produced per worker increases over time. This has slowed in recent decades[28] and is forecast to slow further.[29] This means that, in the long term, income growth will also slow, making it harder for households to afford to pay the taxes, rates and user charges that fund infrastructure investment.
New Zealand’s population is ageing
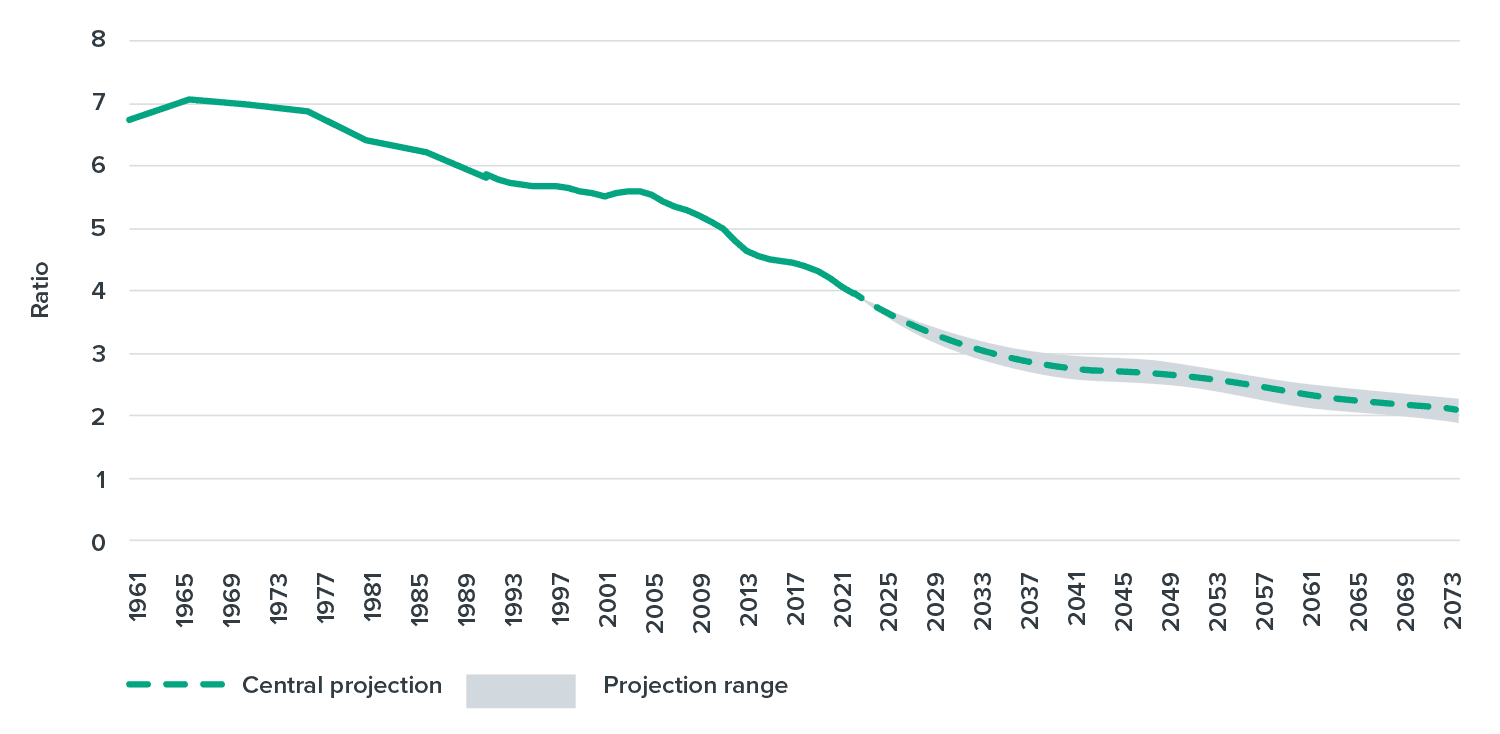
Source: Adapted from ‘Paying it forward: Understanding our long-term infrastructure needs’. New Zealand Infrastructure Commission. (2024).
Figure 4: Ratio of working-age people to people over the age of 65, 1961–2073
1.2.5. Central and local government are feeling the squeeze
Central and local government face fiscal pressures. This will make it challenging to sustain current per capita investment, let alone spend more. Central government has been running structural budget deficits. ‘Structural’ means that it is being driven by things other than short-term economic shocks. The structural deficit is forecast to be around 2.4% of GDP. Under a baseline scenario, this means that net core Crown debt will reach 115% of GDP in 2050 and continue to climb (Figure 5).
In the short term this has been driven by several shocks. This includes the impacts of the Global Financial Crisis, Canterbury earthquakes and COVID-19 pandemic on Crown debt ratios. New Zealand’s Crown debt to GDP ratio is currently above the current Government’s fiscal sustainability targets, although it has generally remained lower than many other OECD countries with larger populations and less exposure to natural hazards. In the long term, the fiscal trend is driven by hard-to-reverse changes like an ageing population and slowing productivity growth.
Local authorities also face fiscal constraints. This is due to the need to contain their own rising debt-to-revenue ratios (Figure 6). International credit rating agencies have downgraded bond ratings for many local government bodies, suggesting that rising debt may make it more difficult to continue investing in the future.[30]
Infrastructure funding will likely come under increasing pressure. We cannot take it for granted that New Zealand will continue to have one of the highest infrastructure spends among OECD countries. To sustain high-quality infrastructure services, we need to get smarter. That could be by reducing costs, easing the regulatory environment or taking a more commercial approach to infrastructure whereby we vastly lift the bar on project quality, finding new projects that households and businesses will be willing to pay more for.
Both central and local government face fiscal constraints
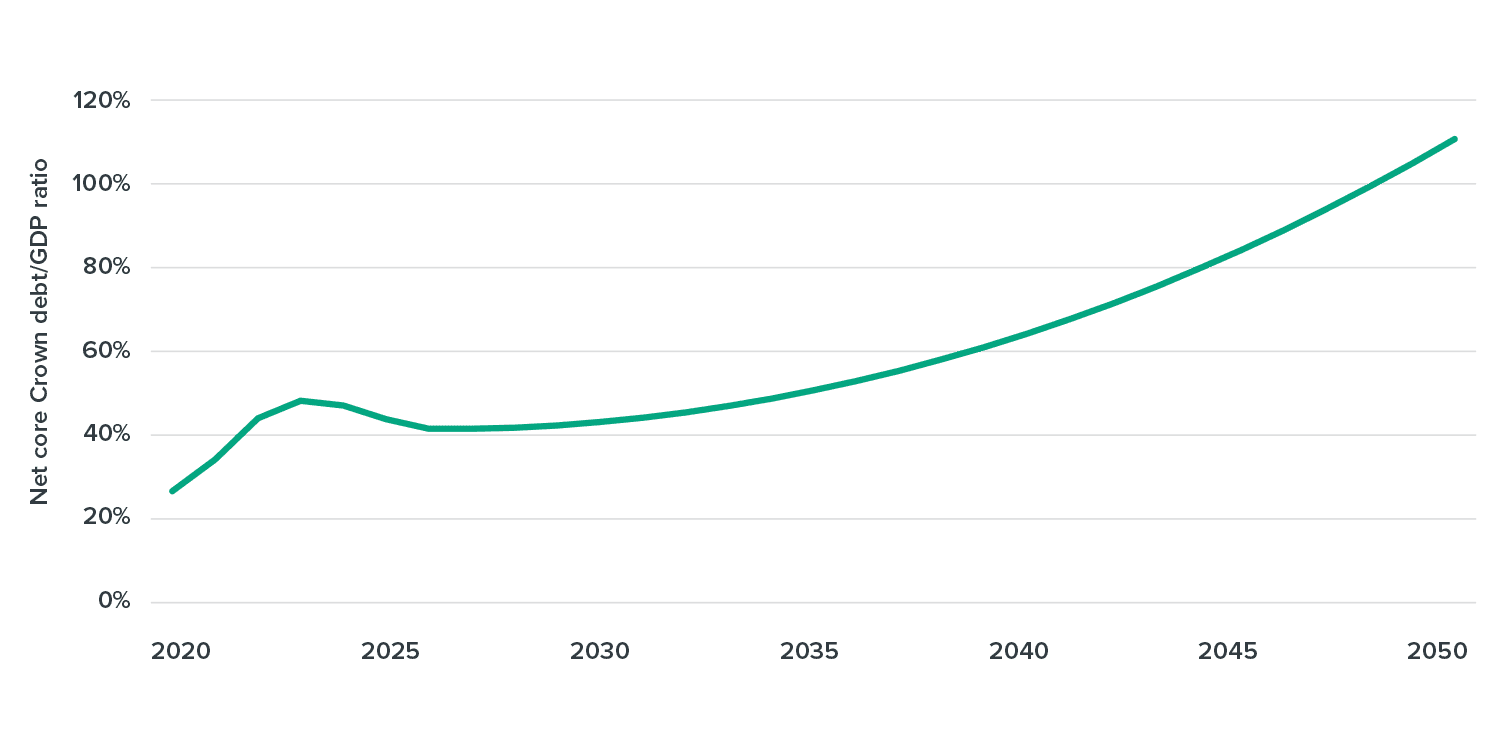
Source: Adapted from ‘Longevity and the public purse: Fiscal and economic impacts of increasing longevity’. Speech prepared for Dominick Stephens, Chief Economic Advisor. The Treasury. (2024).
Figure 5: New Zealand net core Crown debt projections as a share of GDP
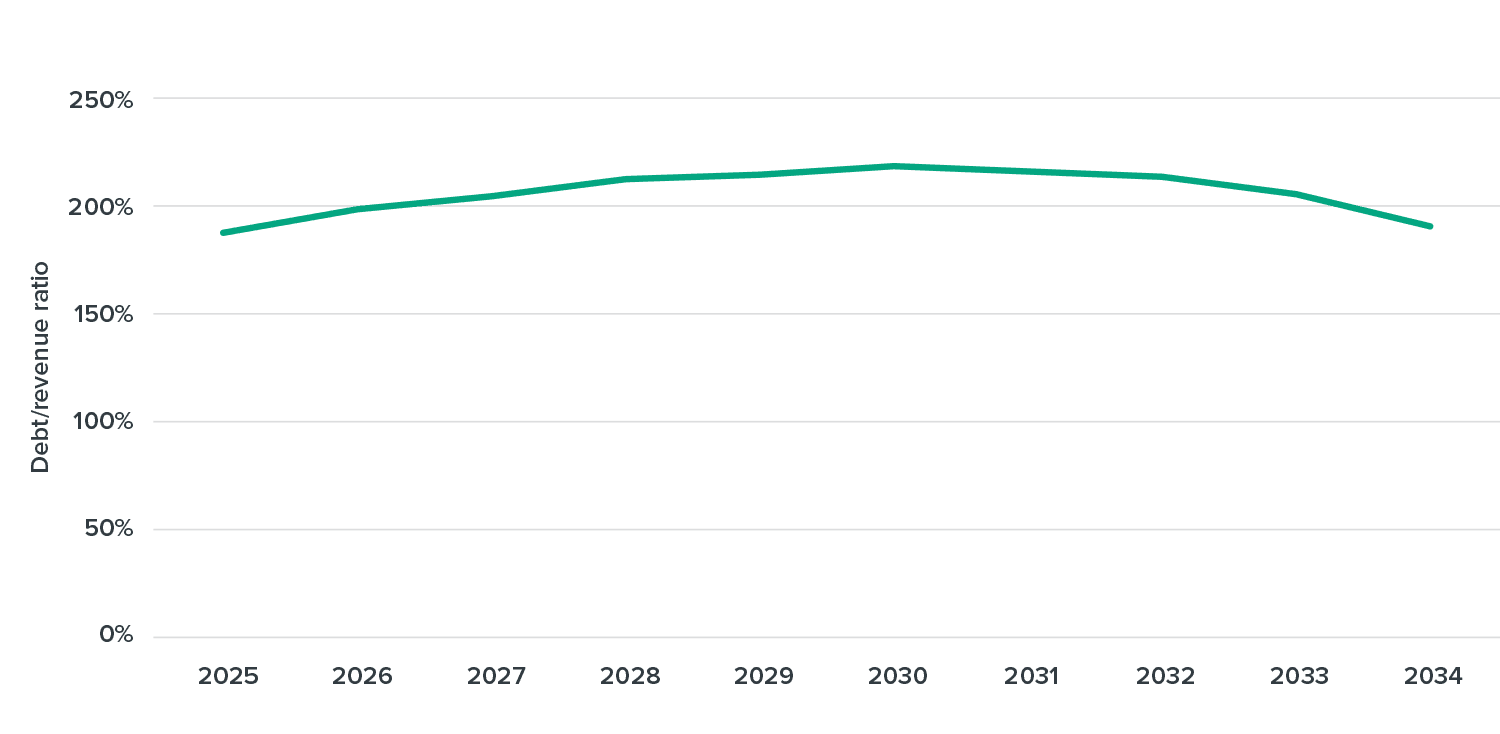
Source: Adapted from ‘Observations from our audits of councils’ 2024-34 long-term plans’. Office of the Auditor-General. (2025).
Figure 6: Local government debt as a percentage of total revenue, 2024 long-term plans
1.2.6. Households also face affordability constraints
New Zealanders have mixed views about paying higher taxes or user charges to increase infrastructure spending. While we are not always happy with the infrastructure that already exists, survey data suggests that less than half of New Zealanders would be willing to pay higher charges or taxes to increase infrastructure spending (Figure 7).[31]
Household affordability constraints will bite harder as our population ages. More people will be on fixed incomes, and fewer people will be able to afford to pay more of their incomes to pay for more investment. Increasing user charges in one area, like electricity or water, will make it harder to afford higher charges in another area, like transport.
New Zealanders expect better infrastructure spending, not necessarily more. People are likely to be willing to pay a bit more for some things, such as healthcare or specific new projects that offer them large benefits, but across the-board increases are more contested. People seem to prefer that growing or changing needs are met by rebalancing existing spending towards areas of unmet needs and getting more efficient at how they use public money.
New Zealanders have mixed views about paying higher taxes or charges to lift spending
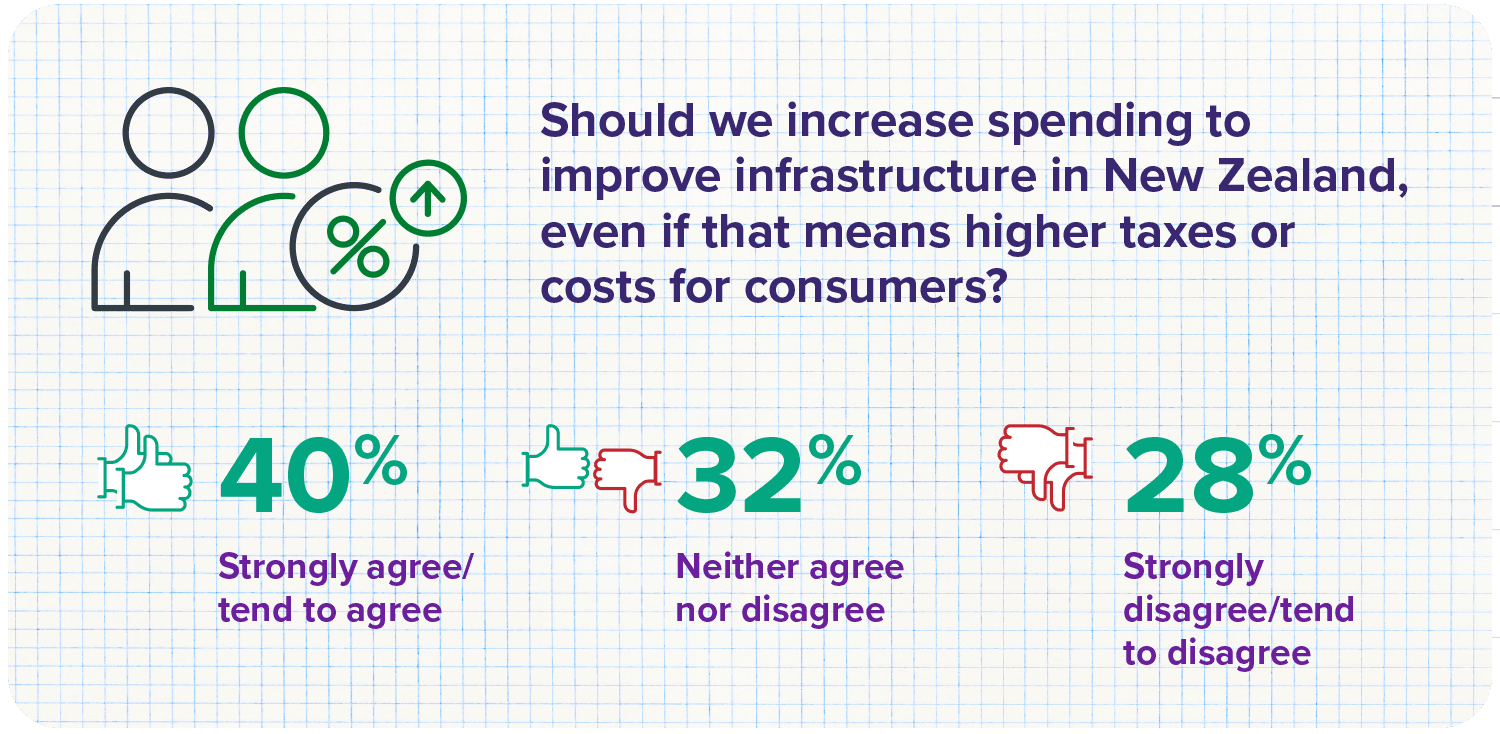
Note: Findings are based on the Global Infrastructure Index (Ipsos & GIIA, 2024), which defined infrastructure as ‘things we rely on like road, rail and air networks, utilities such as energy and water, and broadband and other communications’, excluding social infrastructure. Source: ‘Getting what we need: Public agreement and community expectations around infrastructure’. New Zealand Infrastructure Commission. (2025).
Figure 7: Public preferences for paying more for infrastructure